
WT1_Hanhh
It is the first time I have written Ietls writing task1. It would be grateful if you could check my mistakes. Thank you so much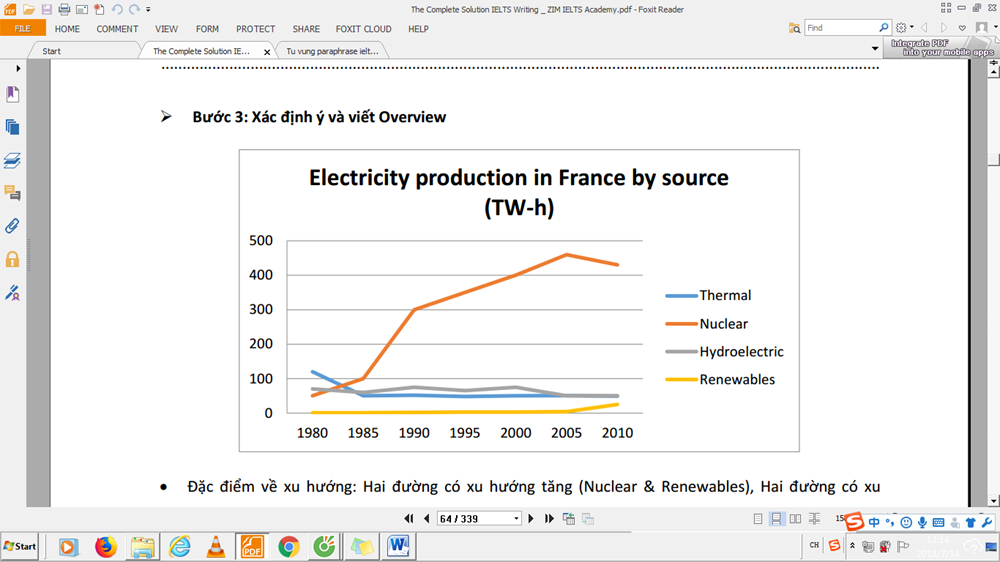
The line graph compares the amount of electricity generated in France using 4 differrent sources of power over the period of 30 years from 1980.
Overall, electricity production from nuclear and renewable energy saw upward trends during the period shown. The opposite trend was true for the other kinds of fuel.
In 1980, nuclear power provided roughly 50 Twh while the figure for renewables was negligible. Over the next 30 years, electricity generation through nuclear energy rised dramatically to a peak of 430Twh in 2005 and then slightly declined to approximately 410 Twh in 2010. Seeing the same trend, the amount of electricity from renewable energy remained stable before moderately increase to 20 Twh in 2010.
Providing 110Twh in 1980, thermal power was by far the most importance means of electricity production in France whereas hydroelectricity power counted as the second main source with 80Twh of power. The figure for thermal electricity generation fell significantly to 50Twh in 1985 and remained at this level for the rest of the period. Hydroelectricity-generated electricity remained relatively steady at between 50 and 80 for the whole 30-year period.
Top answer
) over the period of 30 years from 1980. Overall, electricity production from nuclear and renewable energy saw upward trends during the period shown. The opposite trend was true for the other kinds of fuel.
- ) over the period of 30 years from 1980.
- Overall, electricity production from nuclear and renewable energy saw upward trends during the period shown.
- The opposite trend was true for the other kinds of fuel.
- (Not quite right.
- ) In 1980, nuclear power provided roughly 50 Twh while the amount produced by figure for renewables was negligible.
Get the Weekly English Kit 📬
New words, one handy idiom, and a 2-minute quiz — delivered to your inbox to keep your streak alive.
The line graph compares the amount of electricity generated in France using 4 differrent sources of power (what sources?) over the period of 30 years from 1980.
Overall, electricity production from nuclear and renewable energy saw upward trends during the period shown. The opposite trend was true for the other kinds of fuel. (Not q
 Related Questions