
WT1: the percentage of the population by age groups in the town who rode bicycles in 2011
Please help me to find check this essay. Thank you <3
The table gives information about the proportion of people using bicycles frequently across age groups in a town in 2011.
Overall, it's clear that the percentage of females riding bicycles was much more than that of males in every age groups and the figure declined until people were at the middle age before rising slightly with the old. A half of youngsters at 0-9 age group chose to ride bicycles with 51,3% of girls and 50,3% of boys. Then, at the teenage period from 10-17 years old, the rate of girls using bicycles decreased by 10% to 42,2% wheres the figure for boys reduced a half to 24,6%. The percentage of bicyclers accounted in the town was much lower after that among residents aged 18-39 and 40-59. Both of the two figures jumped to the lowest point at 12,3% of females and 8,3% of males when people came to the age of 49. With people aged over 60, there was a slight increase in the rate of bicyclers in both genders which was 18,5% for women and 13,2% for men.
In conclusion, the youngsters and the old had more spare time to ride bikes.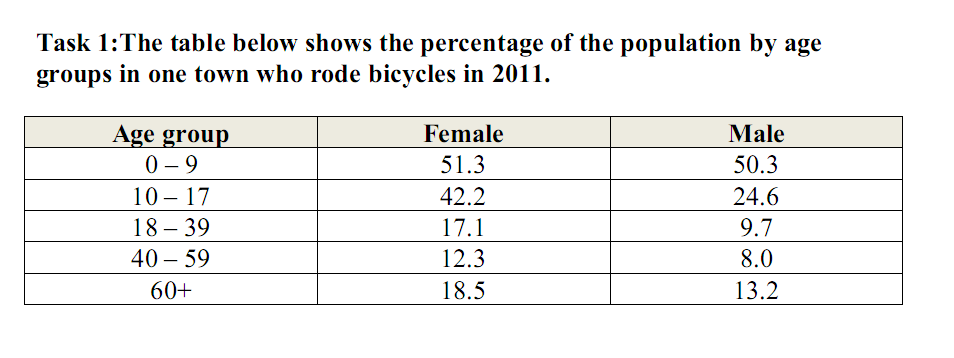
Top answer
) across age groups in a town in 2011. Overall, it's clear that (Those words express your opinion. IELTS Task 1 requires that you only describe the graph, chart, table, or map.
- ) across age groups in a town in 2011.
- Overall, it's clear that (Those words express your opinion.
- IELTS Task 1 requires that you only describe the graph, chart, table, or map.
- ) T he percentage of females riding bicycles was much more than that of males in every age groups and the figure declined until people were at the middle age (Be more precise) before rising slightly for the oldest group.
- with the old .
Get the Weekly English Kit 📬
New words, one handy idiom, and a 2-minute quiz — delivered to your inbox to keep your streak alive.
The table gives information about the proportion of people using bicycles frequently (??) across age groups in a town in 2011.
Overall, it's clear that (Those words express your opinion. IELTS Task 1 requires that you only describe the graph, chart, table, or map. Your score will be lower if you state an opinion or concl
 Related Questions