
(WT1) Please help me to check this essay. Thank you
You should spend about 20 minutes on this task.
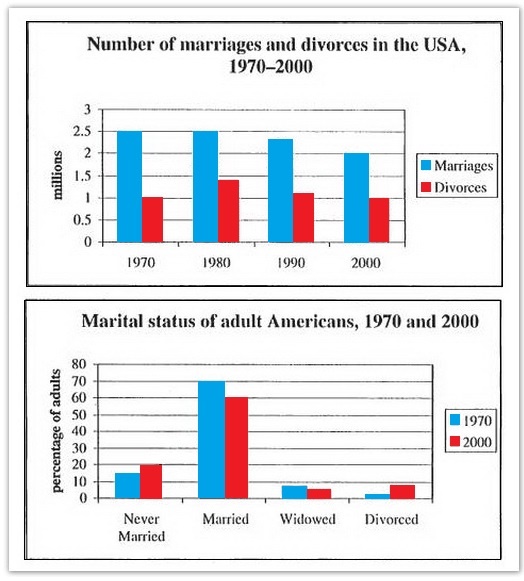
The charts below give information about USA marriage and divorce rates between 1970 and 2000, and the marital status of adult Americans in two of the years.
Summarise the information by selecting and reporting the main features, and make comparisons where relevant.
* MY ESSAY
The first chart gives data about marriages and divorces in the USA from 1970 to 2000 and the second one illustrates the percentage of adults according to their marital status in the two years.
Overall, the number of marriages in USA declined considerably whereas the figure for divorces varied unpredictably. It could be seen from the second chart that most adult Americans were married although the percentage of married people witnessed a decrease.
For the first ten years, there was a stability in the number of marriages which was 2.5 millions while a increase was seen in the other category from 1 to 1.4 millions in 1980. In the remaining of the period, the number of marriages went down regularly from 2,5 millions to 2 millions which is similar to that for divorces from 1.4 to 1 millions in the last year.
The proportion of married people was at the peak of 70% and then declined to 60% by 2000. Similarly, the figure of widowed adults went down to the bottom of the marital adult percentage scale at 5%. In contrast, there was same trends of increase between the number of married and divorced people from 15 to 20% with the former and from 1 to 9% with the latter.
Thank you so much for helping me <3
Top answer
The first chart gives data about marriages and divorces in the USA by decade from 1970 to 2000 and the second one illustrates gives the percentage of adults according to their marital status in the two years , 1970 and 2000 . ) Overall, the number of marriages in USA declined by 20% considerably whereas the figure for divorces varied unpredictably. It could be seen from the second chart that most adult Americans were married although the percentage of married people witnessed a decrease.
- The first chart gives data about marriages and divorces in the USA by decade from 1970 to 2000 and the second one illustrates gives the percentage of adults according to their marital status in the two years , 1970 and 2000 .
- ) Overall, the number of marriages in USA declined by 20% considerably whereas the figure for divorces varied unpredictably.
- It could be seen from the second chart that most adult Americans were married although the percentage of married people witnessed a decrease.
- 4 millions in 1980.
- 4 to 1 millions in the last year.
Get the Weekly English Kit 📬
New words, one handy idiom, and a 2-minute quiz — delivered to your inbox to keep your streak alive.
The first chart gives data about marriages and divorces in the USA by decade from 1970 to 2000 and the second one illustrates gives the percentage of adults according to their marital status in the two years, 1970 and 2000. (Be more specific!)
Overall, the num
 Related Questions