
WT1 - BAR CHART
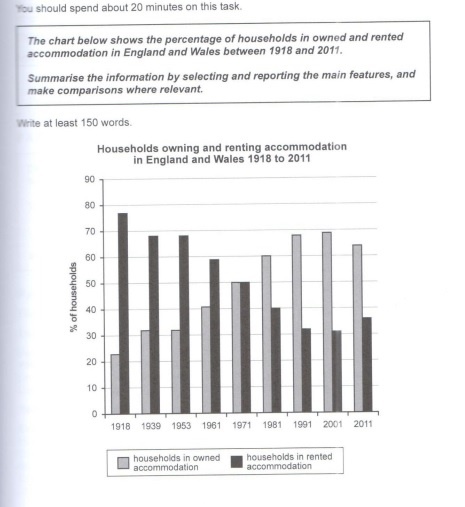
The bar chart compares the proportion of households owning and renting accomodation in England and Wales from 1918 to 2011.
Over the period, there was an increase in the percentage of households in owned accomodation, whereas the figures for those in rented accomodation decreased. The proportion of residents owning accomodation was always higher until 1971.
In 1981, over 75% of the population in England and Wales owned the accomodation, which was about three times higher than the equivalent figures for the tenants. 1971 saw the biggest changes, only half of England and Wales’ residents owned the accomodation, which was the same amount of those renting accomodation.
From 1981 to 2011, renting accomodation became the more popular choice to the residents. The percentage of people choosing to rent accomodation rose steadily to peak at almost 80% in 2001, while the figure for those owning the accomodation reached the bottom at above 30%. In 2011, there were a growth by 3% in the owning, and a decline by the same amount in the renting.
Please give me some comments if there is any errors.
Top answer
Please look at the graph carefully and start over. The bar chart compares the proportion of households owning and renting accomodation in England and Wales from 1918 to 2011. Over the period, there was an increase in the percentage of home ownership, households in owned accomodation , whereas the percentage of renters figures for those in rented accomodation decreased.
- Please look at the graph carefully and start over.
- The bar chart compares the proportion of households owning and renting accomodation in England and Wales from 1918 to 2011.
- Over the period, there was an increase in the percentage of home ownership, households in owned accomodation , whereas the percentage of renters figures for those in rented accomodation decreased.
- The proportion of residents people owning their own residences accomodation was always higher wrong word) until 1971.
- In 1981, over 75% (Did you upload the correct bar graph?
Get the Weekly English Kit 📬
New words, one handy idiom, and a 2-minute quiz — delivered to your inbox to keep your streak alive.
Please look at the graph carefully and start over.
The bar chart compares the proportion of households owning and renting accomodation in England and Wales from 1918 to 2011.
Over the period, there was an increase in the percentage of home ownership, households in owned accomodation, whereas the percentage o
 Related Questions