
(WT1 8.10) Please help me by checking this essay. Thank you.
Please help me by checking this essay. Thank you <3
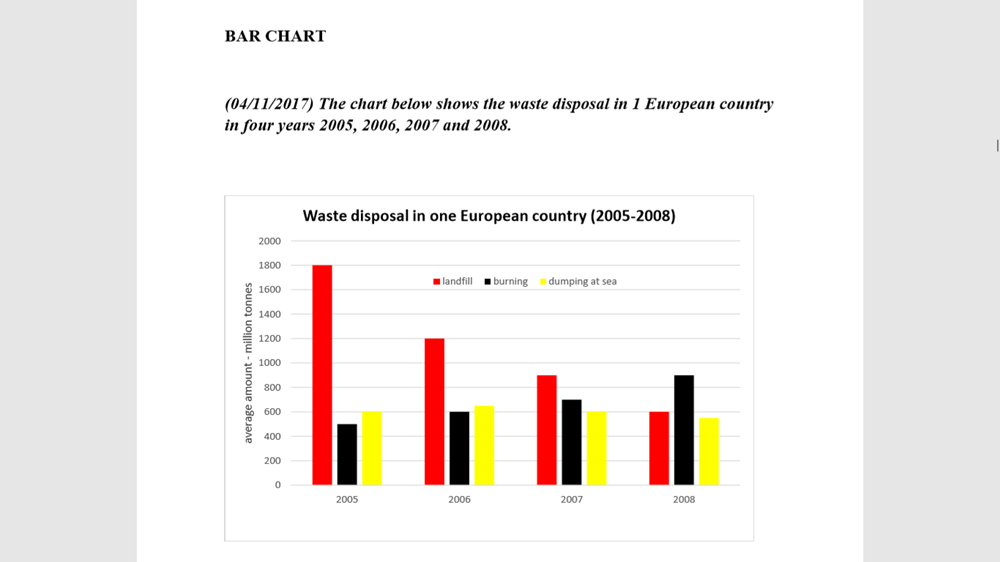
The bar chart gives information about the annual amount of waste disposed by an European country in the period of four years from 2005 to 2008, counted by million tonnes.
Overall, while the amount of waste disposed by landfill showed a remarkable downward trend, the figure of waste burnt was in the opposite tendency.
In 2005, landfill was the most common method used to dispose waste, taking up 180 million tonnes, much higher than the figure of burning and dumping at sea with 500 and 600 million tonnes respectively. Throughout 4 years, there was a considerable increase in the amount of landfill waste to the rock bottom at 600 million tonnes by 2008. In contrast, from the lowest point at the beginning, the amount of waste burnt grew markedly and regularly, making this method of disposing hold the first rank at 900 million tonnes in the last year shown.
Differently, starting off from 600 million tonnes, waste dumped into the ocean experienced a slight increase in its amount, reaching a peak of 620 million tonnes before going down in the remainder of the period to the third rank at 550 million tonnes.
Top answer
The bar chart gives information about the annual amount of waste disposed by an a European country in the period of four years from 2005 to 2008, counted by in million s of tonnes. (Waste is non-count. ) You did not give an adequate description of the figure in the first paragraph.
- The bar chart gives information about the annual amount of waste disposed by an a European country in the period of four years from 2005 to 2008, counted by in million s of tonnes.
- (Waste is non-count.
- ) You did not give an adequate description of the figure in the first paragraph.
- You should mention that it compares three different methods of waste disposal: landfill, burning and dumping in the sea.
- Overall, while the amount of waste disposed by landfill showed a remarkable (be specific.
Get the Weekly English Kit 📬
New words, one handy idiom, and a 2-minute quiz — delivered to your inbox to keep your streak alive.
The bar chart gives information about the annual amount of waste disposed by an a European country in the period of four years from 2005 to 2008, counted by in millions of tonnes. (Waste is non-count. )
You did not giv
 Related Questions