
(WT1 6.10) Please help me with this essay. Thank youuu
Please help me check this essay. Thank you so muchhhh
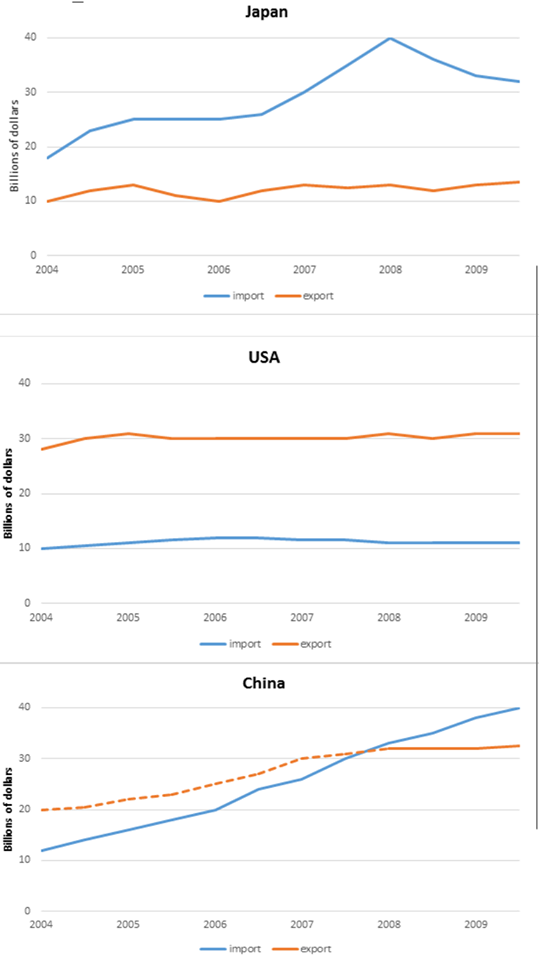
The line graph gives information about the trading value of three countries Japan, USA and China with Australia in the period of 5 consecutive years from 2004 to 2009.
Overall, while the value of import and export in USA remained constant throughout 5 years, the figure for Japan and China showed an increase despite some fluctuations.
At the beginning, the import and export value of China stood at the bottom of 10 and 20 billions of dollars respectively before increasing remarkably to the same point of 20 billions dollars by 2008. Starting off from this point, the import value maintained its height for the next year in constrast with the considerable rise of the other figure to the highest point at 40 billions dollars.
The export value in Japand and USA both experienced a slight growth from 10 to 12 billions of dollars for the former and from 28 to 31 billions of dollars for the latter. After that, there was a substaintial rase in Japanese import value, reaching the peak of 40 billions of dollars, followed by a decrease of about 10 millions of dollars by 2009. In contrast, USA’s export value still kept its position at 10 billions of dollars over the five-year period.
Top answer
The line graph (Look again. ) in the period of 5 consecutive years from 2004 to 2009. The three line graphs show the volume (in billions of dollars) of exports and imports for three countries: Japan, the USA and China over the five-year period from 2004 to 2009.
- The line graph (Look again.
- ) in the period of 5 consecutive years from 2004 to 2009.
- The three line graphs show the volume (in billions of dollars) of exports and imports for three countries: Japan, the USA and China over the five-year period from 2004 to 2009.
- Overall, while the dollar value of import s and expor t s in USA remained constant throughout 5 years, the figure (wrong word) for Japan and China showed an increase despite some fluctuations .
- (wrong word) At the beginning, the import and export value of China stood at the bottom (wrong word) of 10 and 20 billions of dollars respectively before increasing remarkably (Use numerical values, not descriptive words.
Get the Weekly English Kit 📬
New words, one handy idiom, and a 2-minute quiz — delivered to your inbox to keep your streak alive.
The line graph (Look again. Is there only one line graph?) gives information about the trading value (Incorrect expression) of three countries Japan, USA and China with Australia (There was no mention of this country in either the figures or the instructions that you posted.) in t
 Related Questions