
Writting task 1 - Report
I have completed my report on a line graph, somebody please help me check it and identify my mistakes, I'm taking the Ielts in 1 month. Thank you very much!!!
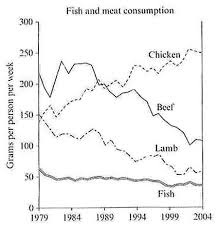
The line graph indicates the amount of four different types of food which people in a European country consummed from 1979 to 2004.
Overall, fish is the least commonly used food throughout the period. Also, the spending on beef, lamb and finish all declined while there was a fluctuating increase in the figure for chicken.
It can be seen from the graph that in 1979, the amount of fish eaten was the lowest among four types of food, with only about 60 grams per person per week. This figure fluctuatingly decreased to around 50 in 2004. Similarly, expenditure on beef also plummeted over the period, even though it was the most comsummed food in 1979. After 25 years, the figure reduced from more than 200 to only approximately 100 grams per person per week.
In 1979, the amount of beef and lamb consummed had the same starting index, with approximately 150 grams. From 1979 to 2004, this country witnessed an dramatic growth to 250 grams in the consumption of chicken. In contrast, the figure for lamb steadily dropped and reached only over 50 grams in 2004.
Top answer
The yellow highlighting marks text with errors. The line graph indicates the amount of four different types of food which people in a European country consummed from 1979 to 2004. Your first paragraph is not complete.
- The yellow highlighting marks text with errors.
- The line graph indicates the amount of four different types of food which people in a European country consummed from 1979 to 2004.
- Your first paragraph is not complete.
- What types of food are there?
- Is it the total amount they ate?
Get the Weekly English Kit 📬
New words, one handy idiom, and a 2-minute quiz — delivered to your inbox to keep your streak alive.
The yellow highlighting marks text with errors.
The line graph indicates the amount of four different types of food which people in a European country consummed from 1979 to 2004.
Your first paragraph is not complete. What types of food are there? Is it the total amount they a
 Related Questions