
Writting task 1 - book reading
The table and chart show data about reading among people under 30 years old.
Summarise the information by selecting and reporting the main features, and make comparisons where relevant.
The chart and table indicate the percentage of people who read books in different genres by 16-29 age group, and how many books they read on average in 2012.
It is noticeable that most youngsters enjoy the print book. The majority of 16-17 years old people were read more books than the rest.
To begin with, 85 perce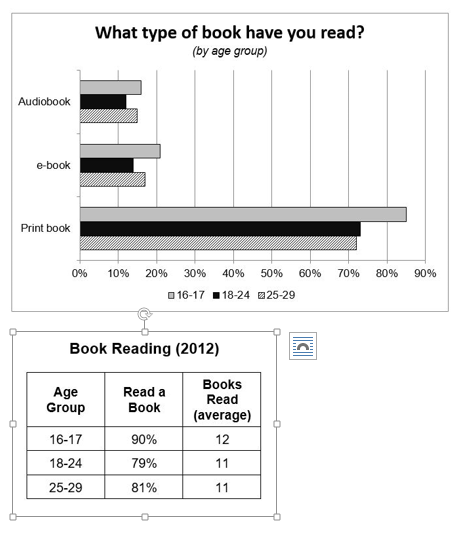
nt of young people from 16 to 17 years old read the paper book. The figures fall slightly when they are at the age of 18-29, at 72-73 percent. By contrast, only under 22 percent of young people at all three age group enjoy reading on the Internet and listening audio.
As is observed from the table, in 2012, 90 percent of the youngest age group read 12 books on average. 81 percent for the reader at 25-29 ages compared to 79% for those who 25-29 years old. However, average books which both age group read were 11.
Top answer
) indicate the percentage of people who read books in different genres (Wrong word. Genre refers to descriptions like fiction, non-fiction, and poetry. ) and how many books they read on average in 2012.
- ) indicate the percentage of people who read books in different genres (Wrong word.
- Genre refers to descriptions like fiction, non-fiction, and poetry.
- ) and how many books they read on average in 2012.
- It is noticeable that most youngsters (Wrong word) enjoy (This is your conclusion or opinion.
- In Task 1, do not write opinions or conclusions.
Get the Weekly English Kit 📬
New words, one handy idiom, and a 2-minute quiz — delivered to your inbox to keep your streak alive.
The chart and table (The chart and table show different things, so it is not good to write one sentence.) indicate the percentage of people who read books in different genres (Wrong word. Genre refers to descriptions like fiction, non-fiction, and poetry. ) by 16-29 age group,
 Related Questions