
Writing Task1_Line graph
My name is Yen. Now I am learning English to how to write a Task1 of IELTS Writing. Could you help me to correct my mistake and give your opinion, please. Thank you in advance.
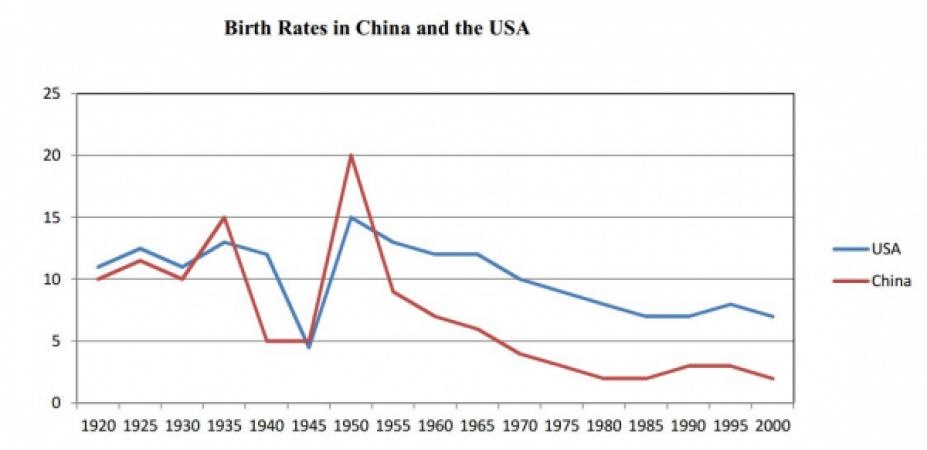
The line chart illustrates how the fertility rate in the two countries namely American and China changed over a period of 80 years from starting in 1920.
Overall, the 80-year period saw a decrease in the birth rates of both countries. Although the two trends were similar in terms of general decline, the figure for the US was higher than that of the Chinese almost all the time surveyed.
In the 1920-1935 period, the birth rate of the US fluctuated, although it always remained above 10%. However, in the following decade, the American birth rate considerably went down by 8%. In the 1950s, the figure for the USA sharply increased to exactly 15%, which is the highest point of its own during the 80-year period. Throughout the next half of the century, there was a gradually decline in the US birth rate, which felt to approximately 7% by the year 2000.
Over the same period, the birth rate in China varied more significantly than that in America. It dropped from 15% to 5%, a fall of 10% in just 10 years from 1935. This figure kept levelling out at the 5% until 5 years later before reaching a peak of 20% in 1950. By contrast, the Chinese birth rate decreased to only 2% in the 2000, which was its lowest point of the whole graph.
Top answer
The line chart illustrates how the fertility birth rate in the two countrie s, namely American the US and Chin a, changed over a period of 80 years from starting in 1920. Overall, the 80-year period saw a decrease in the birth rates of both countries. Although the two trends were similar in terms of general decline, the figure rate for the US was higher than that of the Chinese for China over almost all that timespan.
- The line chart illustrates how the fertility birth rate in the two countrie s, namely American the US and Chin a, changed over a period of 80 years from starting in 1920.
- Overall, the 80-year period saw a decrease in the birth rates of both countries.
- Although the two trends were similar in terms of general decline, the figure rate for the US was higher than that of the Chinese for China over almost all that timespan.
- the time surveyed.
- In the 1920-1935 period, the US birth rate of the US fluctuated, although it always remained above 10%.
Get the Weekly English Kit 📬
New words, one handy idiom, and a 2-minute quiz — delivered to your inbox to keep your streak alive.
The line chart illustrates how the fertility birth rate in the two countries, namely American the US and China, changed over a period of 80 years from starting in 1920.
 Related Questions