
Writing task1 : The online shopping sales. Please help me!!!
The two pie charts below show the online shopping sales for retail sectors in Canada in 2005 and 2010.
Summarise the information by selecting and reporting the main features, and make comparisons where relevant.
Write at least 150 words.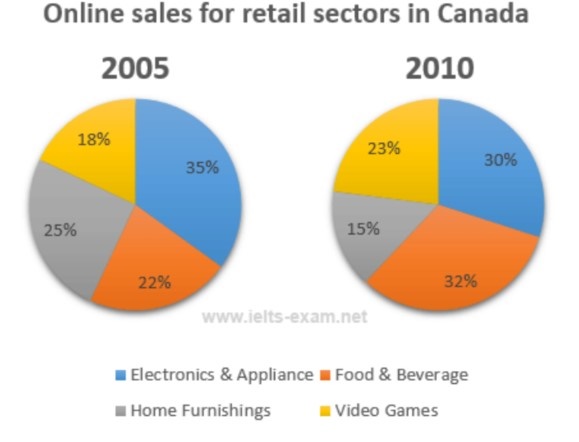
The two pie charts compare four major items in Canada in terms of the proportion of their internet-based sales between 2005 and 2010.
Overall, the percentages of Electronics and Appliance and Food and beverage collectively were the highest figures in two years. While the proportions for Food and beverage and Video games increased, the figures for the two remaining sectors fell.
In 2005, the proportion for Electronics and Appliance stood at 35% of the total and then this figure declined 5% by 2010. A similar trend was seen in Home furnishings, whose percentage decreased by 10% from a quarter of the total figure in 2005.
Other categories followed different patterns in percentages between 2005 and 2010. The proportion of Food and beverage and Video games rose 10% to 32%, which was the highest figure for retail items in 2010. There was also an increase of 5% in Video games, which saw a rise from 18% to 32% in five years later.
Top answer
Please help me check my grammar is right or not? Are my sentences clear enough? Thank you a lot
- Please help me check my grammar is right or not?
- Are my sentences clear enough?
- Thank you a lot
Get the Weekly English Kit 📬
New words, one handy idiom, and a 2-minute quiz — delivered to your inbox to keep your streak alive.
Please help me check my grammar is right or not? Are my sentences clear enough? Thank you a lot
The two pie charts compare four major items (wrong word. An item is a specific thing, like a LaCosta white T-shirt, size large.) in Canada in terms of the proportion of their internet-based sales between 2005 and 2010.
Your paragraph is not complete. What are the categories?
 Related Questions