
Writing task 1.Please help me . Give me some comment below. Thanks
The line graph compares the population change from 1940 to 2000 in the three different countries in the U.S.state.
Looking at the line graph, it is immediately obvious that the people who lived in Washington was largest and the figure for Columbia was lessest between 1940 to 2000.
In 1940, the first year on the graph, the number of people who lived in Washington was highest, at 75 millions, while the figure for Yamhill was significantly lower, at 30 millions, compared to 25 m for Columbia.
In 1970, the amount of population to Washington increased sharply about 125 millions. In addition, there was also changed of population in Yamhill and Columbia but this had slight, changing less than 20 millions.
Thirty years later, the population continued to rose. Interestingly enough, in washington, the population lifted suddenly and reach a peak of around 240 millions. Meanwhile, the number of people who lived Yamhill increased
at 90m, compared to 75m for Columbia.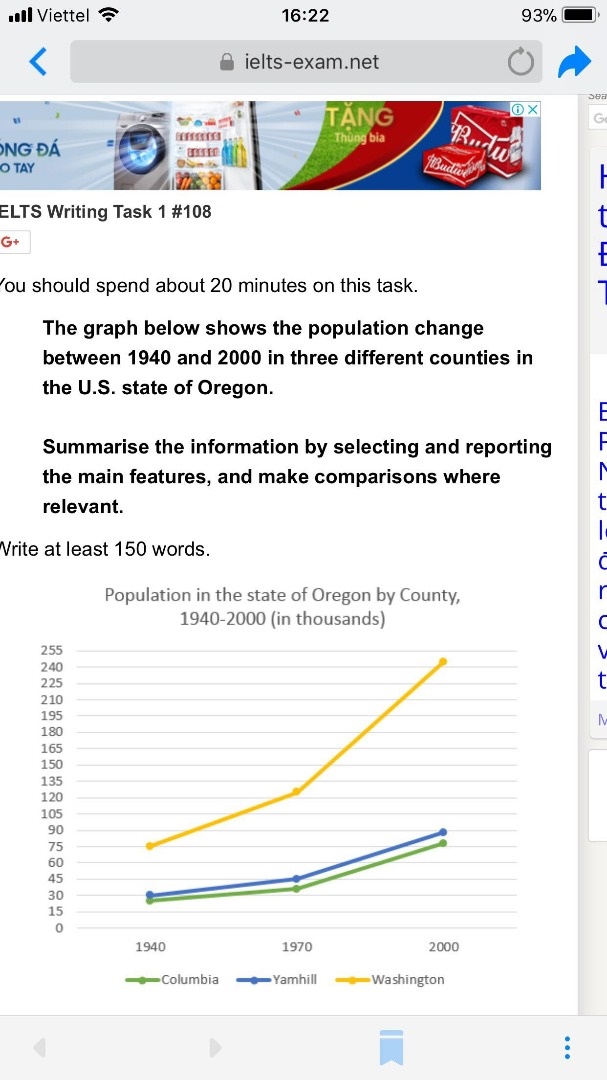
Top answer
state . ) Looking at the line graph, it is immediately obvious that (You wrote an opinion. "Obvious" is your opinion.
- state .
- ) Looking at the line graph, it is immediately obvious that (You wrote an opinion.
- "Obvious" is your opinion.
- ) T he people who lived in Washington (missing word) was largest (People were largest = they were tall and fat.
- That is not what you mean.
Get the Weekly English Kit 📬
New words, one handy idiom, and a 2-minute quiz — delivered to your inbox to keep your streak alive.
The line graph compares the population change from 1940 to 2000 in the three different countries (wrong word) in the U.S.state. (Which state?)
Looking at the line graph, it is immediately obvious that (You wrote an opinion. "Obvious" is your opinion. In ta
 Related Questions