
WRITING TASK 1_EXPORT EARNINGS
This is my next writing as a practice. Please read it and give me some advice for improvement. Any feedback is highly appreciated. Thank you very much.
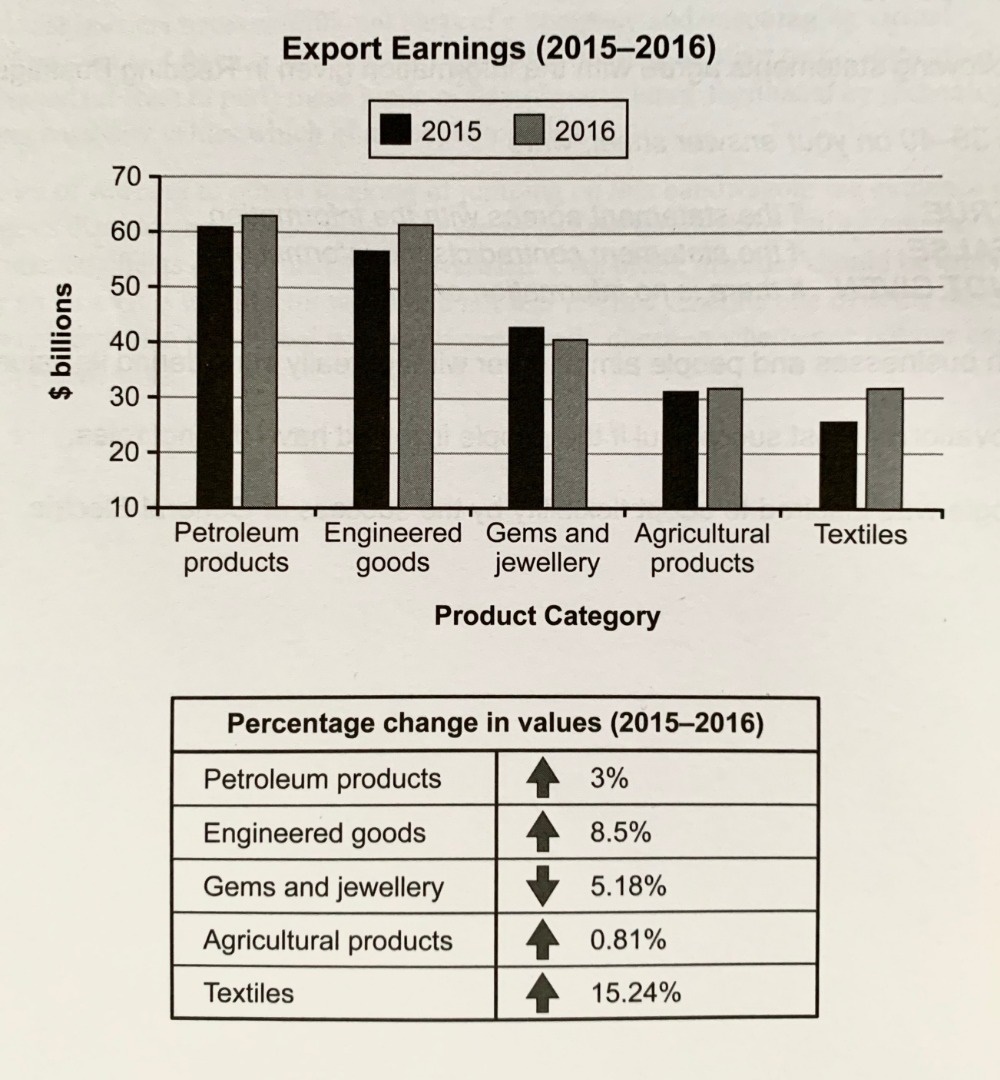
The chart below shows the value of one country's exports in various categories during 2015 and 2016. The table shows the percentage change in each category or exports in 2016 compared with 2015.
.
The bar chart plots the changes in export income of five particular product categories, which are petroleum products, engineered goods, gems and jewellery, agriculture products, and textiles, in 2015 and 2016. The measurement unit is $ billions. Additionally, the given table gives information about the changes in these categories in percentage terms from 2015 to 2016.
Overall, more than 50% the export earnings came from petroleum products and engineered goods in both years, while textiles contributed the least to total export earnings among all. From 2015 to 2016, only gems and jewellery had a decrease in their income, while there were upward trends for others.
In 2015, petroleum products earned the highest with about 60$ billion. In the next year, it climbed slightly to about 62$ billion, which counted as an increase of 3%. Engineered goods grew faster by 8.5% from around 55$ billion to more than 60$ billion. Although the textiles’ share of the total income was the least, they grew faster than any other product category in one year, levelling off up to 15,24%. The almost negligible change occurred in agriculture products, which decreased only 0,81% over the year.
.
This time, I have made some small calculations in the overview paragraph. Are they correct?
Also, there are two charts in this exercise, which is different compared to before. Do you have any advice for the kind of exercise consisting of many charts, graphs or tables?
Thank you.
Top answer
The bar chart plots [ 1] outlines a/one country’s the changes in export [ 1] income / earnings of from five particular product categories, which are petroleum products, engineered goods, gems and jewellery, agriculture products, and textiles, in 2015 and 2016. The measurement unit is billions of dollars . Additionally, the given table [ 2] provides gives information about the changes in these categories in percentage terms from 2015 to 2016.
- The bar chart plots [ 1] outlines a/one country’s the changes in export [ 1] income / earnings of from five particular product categories, which are petroleum products, engineered goods, gems and jewellery, agriculture products, and textiles, in 2015 and 2016.
- The measurement unit is billions of dollars .
- Additionally, the given table [ 2] provides gives information about the changes in these categories in percentage terms from 2015 to 2016.
- Overall, more than 50% of the export earnings came from petroleum products and engineered goods in both years, while textiles contributed the least to total export earning s.
- among all.
Get the Weekly English Kit 📬
New words, one handy idiom, and a 2-minute quiz — delivered to your inbox to keep your streak alive.
The bar chart plots [ 1] outlines a/one country’s the changes in export [ 1] income/earnings of from five particular product categories, which are petroleum products, engineered
I am very sorry if it may cause any inconvenience to you. Just to practise writing with this mixed charts.
Please help me correct it. Thank you so much!
The given bar chart presents one country’s export earnings from five different categories namely petroleum products, engineered goods, gems and jewelry, agricultural products and textiles in 2015 and 2016. The measurement unit is
 Related Questions