
Writing task 1_bar chart
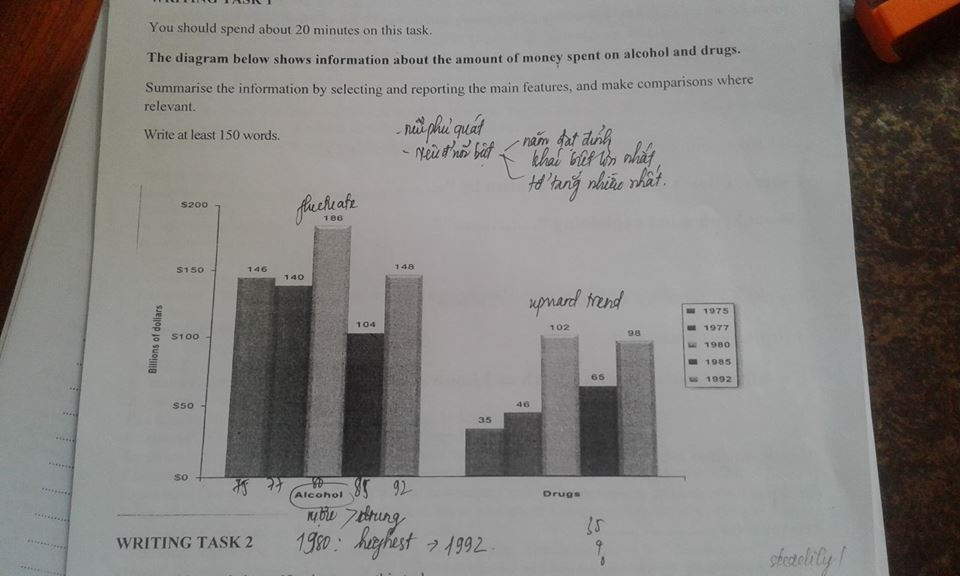
The bar chart indicates how much money was spent on alcoholic beverages and drugs in five separate years 1975, 1977, 1980, 1985 and 1992. Overall, the expenditure of two items reached their peaks simultaneously in 1980.
Looking at alcohol’s spending, people spent the largest amount of money on it in 1980 (roughly 190 billions of dollars) in contrast to just over 100 billions in 1985. In three remaining years, the sales of alcohol were comparable at slightly below 150 billions. To turn to drugs, the by far least drugs purchases were in 1975 with only 35 billions of dollars. And then it soared to it peak occurring in 1980, three times higher than it had been five years earlier. After that, the spending on drugs fell nearly 40% in the next five years before bouncing back to 98 billions in 1992, tripling its 1975 level.
As is illustrated by the graph, purchases of alcoholic beverages outstripped that of drugs over this whole time period. In 1975, drugs sales were one fourth alcohol’s spending ( 146 and 35 respectively). However, the gap was narrowed noticeably with 148 billions for the former and 98 billions for the latter in 1992
Top answer
The bar chart indicates shows how much money was spent on alcoholic beverages and drugs in five separate years 1975, 1977, 1980, 1985 and 1992. Overall, the expenditure of (wrong word, missing word: "on these") two items reached their peaks (peaked) simultaneously in 1980. Looking at alcohol’s spending, ( Wrong usage.
- The bar chart indicates shows how much money was spent on alcoholic beverages and drugs in five separate years 1975, 1977, 1980, 1985 and 1992.
- Overall, the expenditure of (wrong word, missing word: "on these") two items reached their peaks (peaked) simultaneously in 1980.
- Looking at alcohol’s spending, ( Wrong usage.
- Alcohol has no money to spend on anything!
- ") people spent the largest amount of money on it in 1980 (roughly 190 billion dollars billions of dollars ) in contrast to just over 100 billions (wrong form) in 1985.
Get the Weekly English Kit 📬
New words, one handy idiom, and a 2-minute quiz — delivered to your inbox to keep your streak alive.
The bar chart indicates shows how much money was spent on alcoholic beverages and drugs in five separate years 1975, 1977, 1980, 1985 and 1992. Overall, the expenditure of (wrong word, missing word: "on these") two items reached their peaks (peaked) simultaneously in 1980.
 Related Questions