
Writing task 1: water use
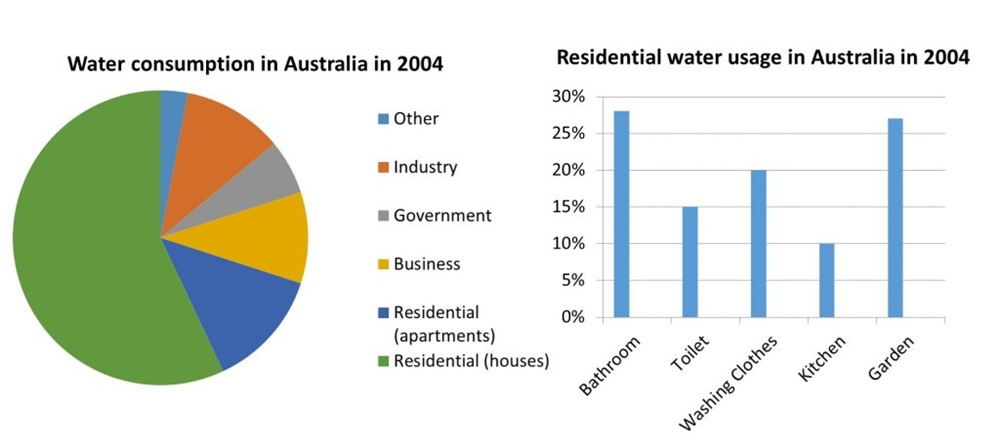
The charts show the amount of water consumed in Australia for 6 purposes and a breakdown of its residential use, in 2004.
In general, more water was dedicated to houses and apartments than the other sectors with most of the domestic usage on bathroom and garden.
Residential purposes accounted for 70% of the total water usage with the percentage for houses by far surpassing apartments’ at 57%. The proportions of industry and business usage were almost exactly the same at 11% and 10%, respectively whereas water consumption for government doubled that for the other purposes at 3%.
Turning to the bar chart, while one single household task, laundering, made up a fifth of the total domestic use, the combined percentages of activities completed on the toilet (15%) and the kitchen (10%) was only negligibly higher. Finally, the other two categories represent nearly identical usage, with figures of 28% for the bathroom and 27% for gardening.
Top answer
Please read my advice for Task 1 essays: IELTS TASK 1: Hints, Tips And Advice Vocabulary Words For Task 1: Reference Post
- Please read my advice for Task 1 essays: IELTS TASK 1: Hints, Tips And Advice Vocabulary Words For Task 1: Reference Post
Get the Weekly English Kit 📬
New words, one handy idiom, and a 2-minute quiz — delivered to your inbox to keep your streak alive.
The (When there are two different kinds of figures, with two different subjects, write a separate sentence for each one. Otherwise, you just confuse the reader.) charts show the amount of water (incorrect. "Amounts" would be 56,000 litres or 5 tonnes. There are no amounts on either fi
 Related Questions