
Writing Task 1: The changes in ownership of electrical appliances
Please help me review my writing.
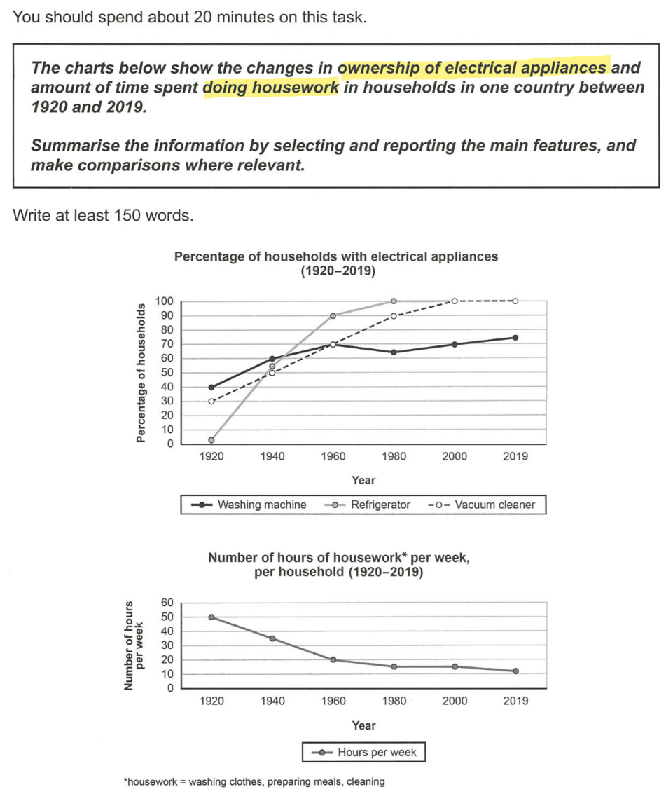
The first line graph indicates percentages of households with three types of electrical equipment
which are washing machine, refrigerator and vacuum cleaner, and the second one indicates weekly expenditure of time on doing chores in families in over a century.
Overall, electrical appliances ownership increased across the period given. Conversely, households progressively spent less time doing housework such as washing clothes, preparing meals or cleaning.
In 1920, 40% of families had a washing machine, 30% had a vacuum cleaner, but refrigerators were not popular at that time, only 1% of families falling into this category. Remarkably, while washing machine and vacuum cleaner figures jointly increased at 60% of households, the percentage of households owning a fridge rose to 90% in 1960. By contrast, they spent 50 hours a week doing housework relative to these appliances in 1920, and the amount of time fell to 20 hours per week in 1960.
In 2000, All families in one country had a fridge and a vacuum cleaner, and remained at this state for the rest of the period, whereas washing machine ownership remained relatively stable, at between 70% and 73% despite experiencing a small decrease in 1980. Likewise, between 1960 and 2019, weekly expenditure of time on doing housework gradually fell from 20 hours to almost 10 hours.
Top answer
Please read my advice for Task 1 essays: IELTS TASK 1: Hints, Tips And Advice Vocabulary Words For Task 1: Reference Post
- Please read my advice for Task 1 essays: IELTS TASK 1: Hints, Tips And Advice Vocabulary Words For Task 1: Reference Post
Get the Weekly English Kit 📬
New words, one handy idiom, and a 2-minute quiz — delivered to your inbox to keep your streak alive.
The first line graph indicates (not a good verb here Read my advice.) percentages of households owning with three types of home appliances, electrical equipment
which are washing machine, refrigerator and vacuum clea
 Related Questions