
WRITING TASK 1 TEST 2 I7
The line graph illustrates the amount of fish consumed and variety types of meat in a European nation from 1979 to 2004.
It can be seen from the graph that, over the surveyed period, beef, lamb and fish consumption decreased while chicken increased. In addition, the consumption of chicken witnessed the most significant change in comparison to the other three.
In 1979, 52 grams per person per week consumed in fish while 150 grams and 230 grams for the consumption of lamb and beef. From 1979 to 1989, the consumption of fish decreased slightly by 48 grams per person per week, then continued it downward trend less slowly to 40 grams in 2004. Between 1979 and 1989, there was a noticeable decreased of 110 grams in lamb, which was followed by a dramatic a fall to 52 grams per person per week in 2004. The 1979-1989 period, experienced a remarkable decreased in beef consumption, from about 230 to almost 200 grams per person per week then continued decreased steeply between 1989 and 2004 from 200 grams to 105 grams.
With the consumption of chicken, between 1979 and 1989 saw a significant upturn of 190 grams per person per week. From 1989 to 2004, there was a sharp growth of amount of 204 grams.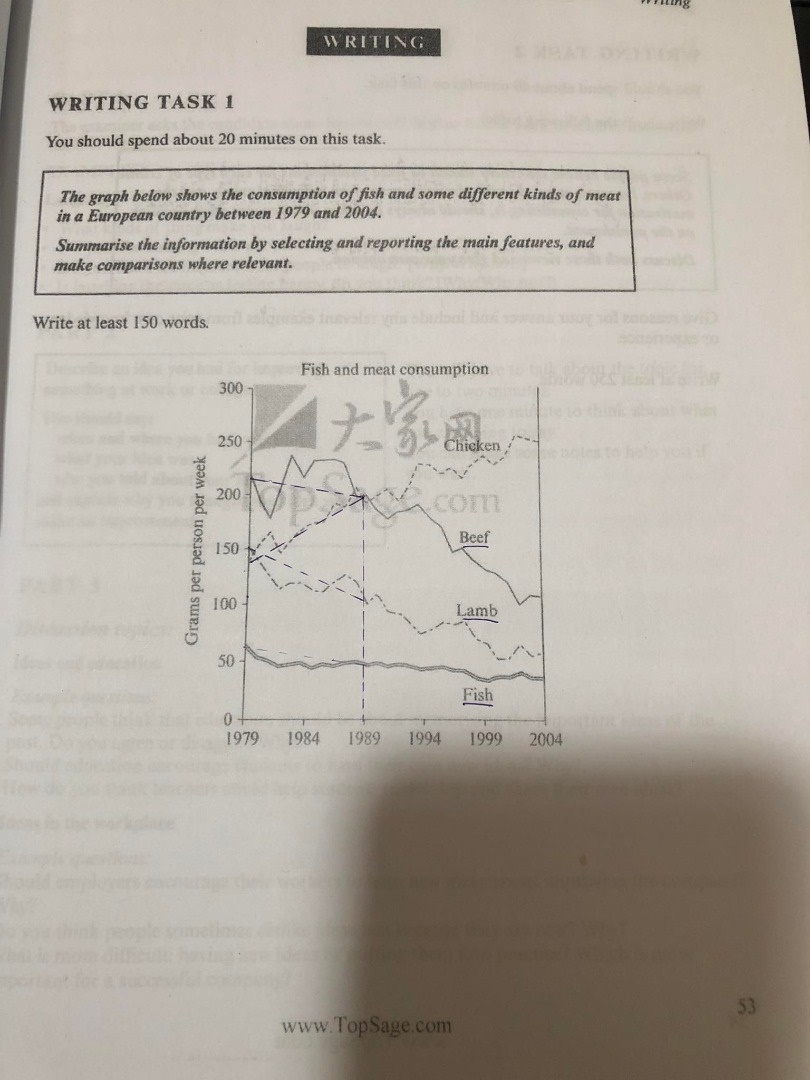
Top answer
The line graph illustrates the amount of fish , lamb, chicken, and beef consumed and variety types of meat per person weekly in a European nation from 1979 to 2004. [ 1] It can be seen from the graph that, over the surveyed period, Overall, beef, lamb and fish consumption decrease d, while the consumption of chicken increased . In addition, the consumption of chicken and witnessed the most significant change in comparison to the other three.
- The line graph illustrates the amount of fish , lamb, chicken, and beef consumed and variety types of meat per person weekly in a European nation from 1979 to 2004.
- [ 1] It can be seen from the graph that, over the surveyed period, Overall, beef, lamb and fish consumption decrease d, while the consumption of chicken increased .
- In addition, the consumption of chicken and witnessed the most significant change in comparison to the other three.
- In 1979, fish consumption was 52 gram s, per person per week consumed in fish while the corresponding figures for lamb and beef were 150 grams and 230 grams , respectively.
- for the consumption of lamb and beef.
Get the Weekly English Kit 📬
New words, one handy idiom, and a 2-minute quiz — delivered to your inbox to keep your streak alive.
The line graph illustrates the amount of fish, lamb, chicken, and beef consumed and variety types of meat per person weekly in a European nation from 1979 to 2004.
[ 1] It can be seen fro
 Related Questions