
Writing Task 1 - Table. Thanks for your help!
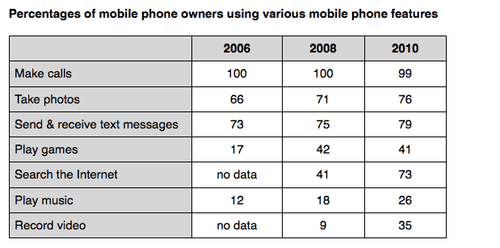
The table above shows the percentage of mobile phone owners using various mobile phone features.
The given table compares the proportion of cell phone owners that used different features on their phones from 2006 to 2010.
Overall, making phone calls was the most common feature, while searching the Internet and recording video became more popular once they became available in 2008.
In 2006 and 2008, all mobile phone users utilized their phones to call others then this figure modestly dropped 1 percent in 2010. The next most popular feature was texting, which experienced a slight increase during the period, from 73 to 79 percent. A similar pattern could be seen in the percentage of people taking photographs by phones, with a 10-percent rise from 2006 to 2010.
The most notable developments were that the proportion of mobile phone game and music players more than doubled. In 2006, only 17 percent of people surveyed used phones to play games, then surged to more than two-fifths in 2010. Similarly, playing music went from 12 percent to approximately a quarter over the four-year period.
Finally, searching the Internet went from being unavailable to the third popular feature in 2010, with 7 percent. Similarly, recording video - a non-exist feature in 2006, was widely used by more than one-third of phone owners surveyed.
(204 words)
P/s: Dear teachers, I have an IELTS exam on April 24th. Please help me review my writings because I will write more than before. Hope you understand for me and thanks a million!
Top answer
The given table compares the proportion of cell phone owners that used different particular features on their phones [ 1] from in the years 2006 , 2008, and to 2010. [ 2] Overall, making phone calls was the most common ly used feature, while searching the Internet and recording video s became more popular once they became available in 2008. --------------------------------------------------------- [ 1]: The original implied data for that you have data for all those years.
- The given table compares the proportion of cell phone owners that used different particular features on their phones [ 1] from in the years 2006 , 2008, and to 2010.
- [ 2] Overall, making phone calls was the most common ly used feature, while searching the Internet and recording video s became more popular once they became available in 2008.
- --------------------------------------------------------- [ 1]: The original implied data for that you have data for all those years.
- [ 2]: Use a single blank line to separate your paragraphs.
- The rest of your text is too long.
Get the Weekly English Kit 📬
New words, one handy idiom, and a 2-minute quiz — delivered to your inbox to keep your streak alive.
The given table compares the proportion of cell phone owners that used different particular features on their phones [ 1] from in the years 2006, 2008, and to 2010.
[ 2]
The given (Do not use given, provided, above or below in your answer. ) table compares the proportion of cell phone owners that used different features on their phones (give the individual years for which you have data) from 2006 to 2010. (Give the reader a sample of the categories.) The table lists
 Related Questions