
Writing task 1. Plz fit to me. Thanks
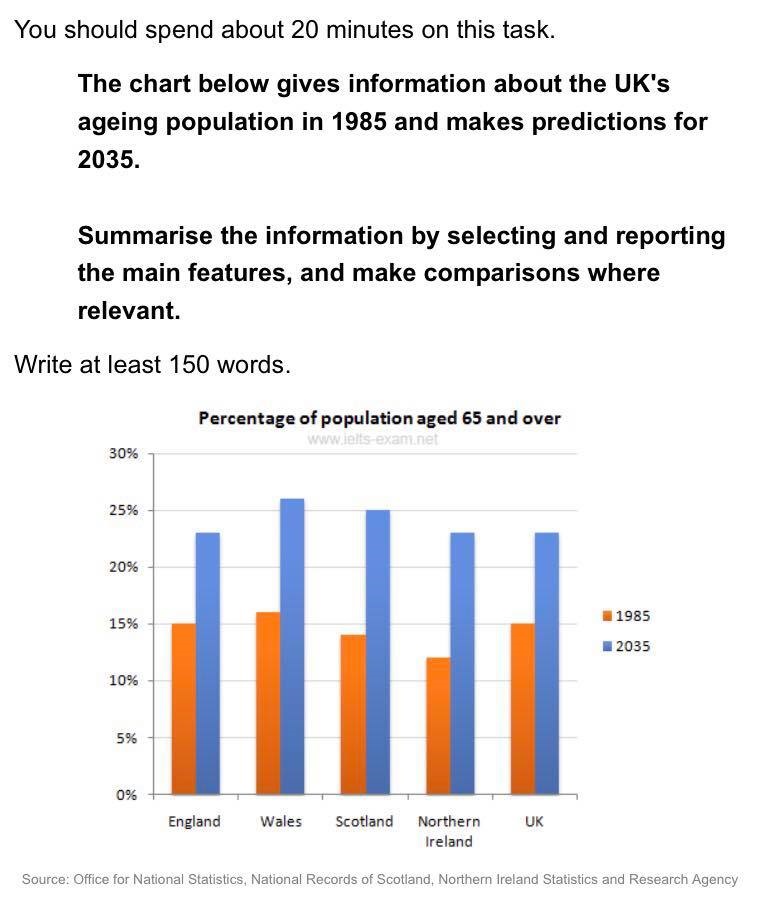
The chart provides a breakdown information of old people in the UK in 1985 and makes expectations for 2035.
Overall, over-65-year-olds is predicted to increasing in 2035, while the difference among areas in the UK is not significant. Besides elderly people in Wale is projected highest in all.
Old people in Wales comprised of 15% in the first year and this is predicted to show a significant of 10% to over 25% in 2035. Likewise, the rate of Scotland was under 15% which is likely to rise to 25% in 50 years later.
With regards to the remaining parts of the UK, there is a 8% growth in the percentage of England over a period of 50 years. Northern Ireland, on the other hand, is the region which sees the most dramatically gap in the two years, with a rise from 12% in 1835 years to 23% in 2035 year.
Top answer
The chart provides a breakdown information of the numbers of old people in various regions in the UK in 1985 and makes expectations gives predictions for 2035. Overall, the number of over-65-year-olds is predicted to increase increasing in 2035, while the difference s among between the various areas in the UK is not significant. Beside s, the number of elderly people in Wale was the highest in 1985 and is projected to remain the highest in future.
- The chart provides a breakdown information of the numbers of old people in various regions in the UK in 1985 and makes expectations gives predictions for 2035.
- Overall, the number of over-65-year-olds is predicted to increase increasing in 2035, while the difference s among between the various areas in the UK is not significant.
- Beside s, the number of elderly people in Wale was the highest in 1985 and is projected to remain the highest in future.
- all.
- Old people in Wales comprised of just over 15% in the first given yea r, and this proportion is predicted to show see a significant rise of 10% to over 25% in 2035.
Get the Weekly English Kit 📬
New words, one handy idiom, and a 2-minute quiz — delivered to your inbox to keep your streak alive.
The chart provides a breakdown information of the numbers of old people in various regions in the UK in 1985 and makes expectations gives predictions for 2035.
Overall, the number of over-
 Related Questions