
Writing task 1: Please take a look and give me advice. I'll appreciate
The graph below shows the average time spent by four car manufacturers to produce vehicles at their US factories.
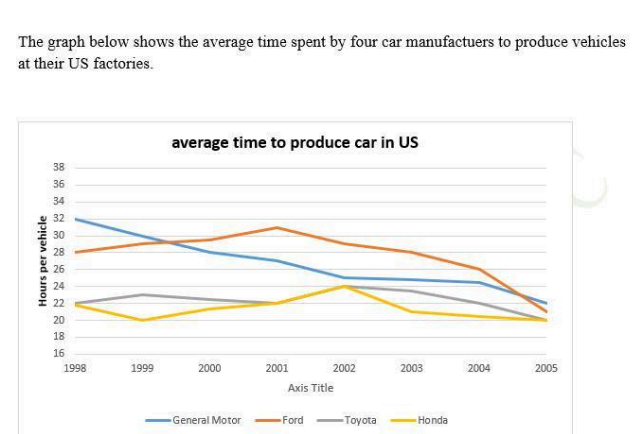
The line graph compares the average number of hour allocated to produce a car by four distinct vehicles corporations including general motor, Ford, Toyota and, Honda in the USA from 1998 to 2005.
Overall, the average time taken to produce a car in US factories decreased over the period. Meanwhile, General Motors reduced the time of car production by more hours than the other companies.
In 1998, General motor spent 32 hours to produce a car, compared to 28 hours by Ford and 22 hours by Toyota and Honda each. Then the number of average hours spent on the production of a car by Ford reached a peak of almost 32 hours in 2001. While the production time generally decreased in the following years, the figures fluctuated.
During the period, there was a slight reduction in the average hours of manufacture for Toyota and Honda, which spent the same production time per car in 2005, 20 hours. General motor showed a consistent decrease to 22 hours to produce a car by 2005. In the same year, there was a drop of 10 hours to just below 22 hours in case of Ford after the time spent considerably fluctuated.
Top answer
The line graph compares the average number of hour (wrong form) allocated (wrong word) required to produce a car by four distinct vehicles (wrong form) corporations manufacturers including general motor , (wrong form - the name is incorrect in the figure. - General Motors) Ford, Toyota an d, Honda in the USA from 1998 to 2005. All data is from plants in the USA.
- The line graph compares the average number of hour (wrong form) allocated (wrong word) required to produce a car by four distinct vehicles (wrong form) corporations manufacturers including general motor , (wrong form - the name is incorrect in the figure.
- - General Motors) Ford, Toyota an d, Honda in the USA from 1998 to 2005.
- All data is from plants in the USA.
- Overall, the average time taken to produce a car in US factories decreased over the period.
- Meanwhile , (wrong word) General Motors reduced the time of car production by more hours than the other companies.
Get the Weekly English Kit 📬
New words, one handy idiom, and a 2-minute quiz — delivered to your inbox to keep your streak alive.
The line graph compares the average number of hour (wrong form) allocated (wrong word) required to produce a car by four distinct vehicles (wrong form) corporations manufact
The line graph gives information about how much time was needed for four car manufacturers to the production of vehicles at the US factories from 1998 to 2005.
Overall, it is evident from the chart that although the numbers of hours per vehicle were different for all four types of manufacturers in the first year, there has been almost the same amount of time by the end of period gi
 Related Questions