
Writing task 1 please review this
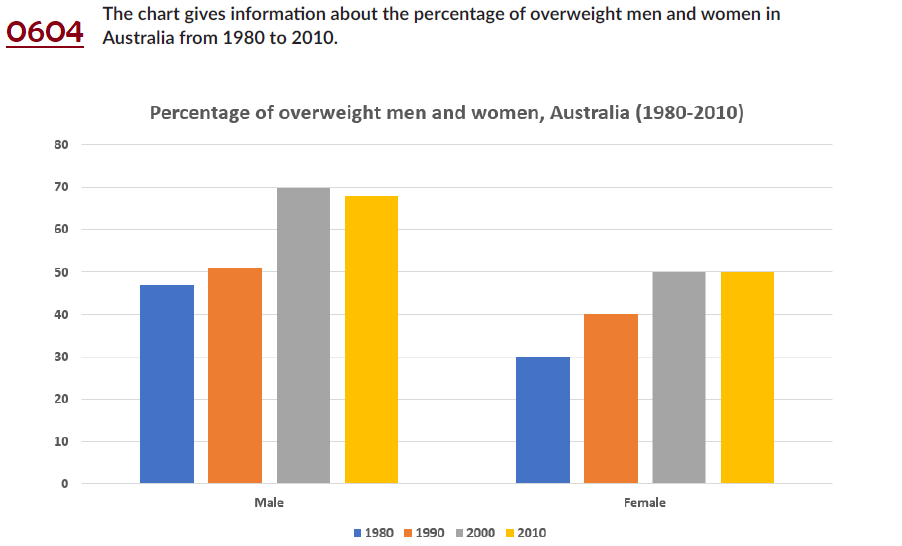
The bar chart plots the proportion of males and females who are overweight in Australia in 20 years period starting from 1980.
Overall, the percentage of men who are overweight are significantly higher than that of women. From 1980 to 2000 the percentage of both genders shown an upward trend, though it is more noticeable in the percentage of men.
Starting out at nearly 47% in 1980, the percentage of overweight men increased slightly to 51% in 1990. Subsequently, the percentage then showed a precipitous rise to 70% in 2000, almost 1,5 times higher than that of women in the same year and its starting value, before dipping a little by the end of the period (roughly 68%).
As to women, the percentage initially stood at 30%, before going up by 10% in 1990 and kept that growth pattern by 2000, 50 %. By the end of the period, the percentage then remained constant, less than approximately 1,3 times when compared with men in the meantime.
Top answer
The bar chart plots the proportion of males and females who were are overweight in Australia in 20 years period (Incorrect phrase. The number 20 is wrong too. Natural time phrases are: - over a thirty-year period - in the period from 1980 to 2010 But these expressions are for continuous plots, that is, line graphs.
- The bar chart plots the proportion of males and females who were are overweight in Australia in 20 years period (Incorrect phrase.
- The number 20 is wrong too.
- Natural time phrases are: - over a thirty-year period - in the period from 1980 to 2010 But these expressions are for continuous plots, that is, line graphs.
- This is not a line graph.
- It shows the values at 4 discrete times.
Get the Weekly English Kit 📬
New words, one handy idiom, and a 2-minute quiz — delivered to your inbox to keep your streak alive.
The bar chart plots the proportion of males and females who were are overweight in Australia in 20 years period (Incorrect phrase. The number 20 is wrong too.
Natural time phrases are:
- over a thirty-year period
- in the period from 1980 to 2010
 Related Questions