
Writing task 1. Please review my Ielts essay
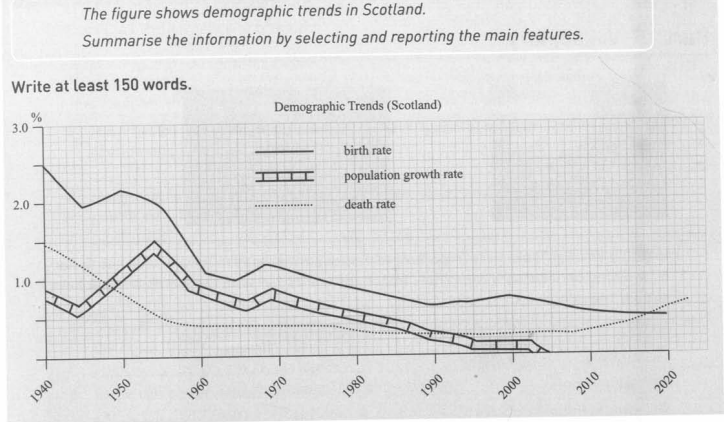
The line chart gives information about the demographic trends in Scotland, namely: birth rate, population growth rate, the death rate from 1940 to 2020 and shows the close relationship between them.
Overall, the proportion of the three categories have experienced gradual changes throughout eighty years. Moreover, ultimately, the whole percentages were under one percent in 2020.
As it is observed, starting at the highest point in 1940 (2,5 percent), the birth rate then dipped to roughly 2% in 1945. After that, it followed by an increase and climbed to 2,2%. However, in the following decades, the Scottish adults bore fewer children, consequently, lead to a sharp fall until 2020.
The population growth rate was also up and down in the first three decades. Since then, this proportion leveled off rapidly and had no significant rise after 2005. (It was at the zero point).
In terms of the death rate, due to a decrease of newborn citizens in Scotland and people have been getting older, the mortality since 2005 had been leveling up. Additionally, it was anticipated to reach the percentage which would be higher than approximately 1 percent in 2020.
Top answer
The line chart gives information about the demographic trends in Scotland, namely: birth rate, population growth rate, the death rate from 1940 to 2020. and shows the close relationship between them . [ 1 ] Overall, the proportion of the all three categories have [ 2] experienced a gradual [ 3] changes throughout decline over those eighty years.
- The line chart gives information about the demographic trends in Scotland, namely: birth rate, population growth rate, the death rate from 1940 to 2020.
- and shows the close relationship between them .
- [ 1 ] Overall, the proportion of the all three categories have [ 2] experienced a gradual [ 3] changes throughout decline over those eighty years.
- Moreover, ultimately, the whole percentages were under one percent in 2020 .
- 5% in 1940 , (2,5 percent) , the birth rate then declined despite slight rises in the second half of the 1940s and the 1960s.
Get the Weekly English Kit 📬
New words, one handy idiom, and a 2-minute quiz — delivered to your inbox to keep your streak alive.
The line chart gives information about the demographic trends in Scotland, namely: birth rate, population growth rate, the death rate from 1940 to 2020. and shows the close relationship between them. [ 1]
Overall, the proportion of the all three categories have [ 2] experienced
 Related Questions