
Writing task 1. Please review it
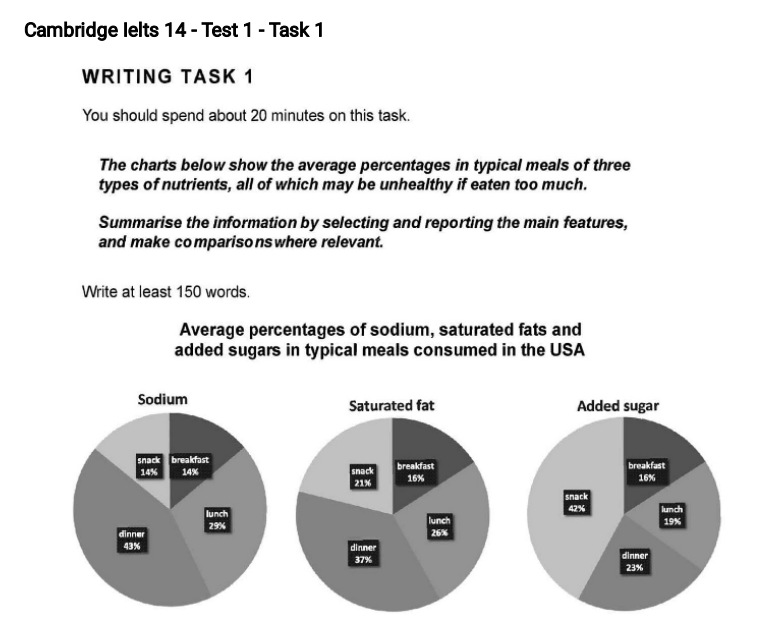
The pie charts give information about the average intake of 3 kinds of nutrients in 4 typical meals in the United States of America. Types of nutrients are sodium, saturated fat and added sugar that may affect negatively to health if consumed too much.
Overall, dinner contains the most proportion of sodium and saturated fat compared to breakfast, lunch and snacks. Breakfast makes up the least intake of 3 kinds of nutrients.
Regard to sodium, breakfast and snacks have the equal percentage of 14%. Whereas lunch has the second largest number with 29%, which doubles that of breakfast or snacks. When it comes to saturated fat, while dinner still occupies more than one- third of the total( 37%), breakfast only takes up more one- tenth of 16%. The percentage in lunch and snacks is 26% and 21% respectively. Finally, snacks is meal rich in added sugar with 42%, which is nearly equal to the sum of percentage in dinner and lunch. The proportion of added sugar in breakfast is the same as that of saturated sugar.
Top answer
) pie charts give information about (That is very vague. ) the average intake (intake would be measured in grams or ounces. ) typical meals in the United States of America.
- ) pie charts give information about (That is very vague.
- ) the average intake (intake would be measured in grams or ounces.
- ) typical meals in the United States of America.
- Types of These nutrients are sodium, saturated fat and added sugar that may affect negatively to (wrong expression) health if consumed too much.
- ) of sodium and saturated fat compared to breakfast, lunch and snacks.
Get the Weekly English Kit 📬
New words, one handy idiom, and a 2-minute quiz — delivered to your inbox to keep your streak alive.
The (How many charts?) pie charts give information about (That is very vague. You did not write what is on the pie chart.) the average intake (intake would be measured in grams or ounces. Are those measurements on these charts?) of 3 kinds of nutrients in
 Related Questions