
Writing task 1. Please help me to correct my essay. Thank you !
https://www.google.com/url?sa=i&rct=j&q=&esrc=s&source=images&cd=&cad=rja&uact=8&ved=2ahUKEwjxvej24LHmAhWQHqYKHZIjCCEQjhx6BAgBEAI&url=https%3A%2F%2Fwww.testbig.com%2Fielts-writing-task-i-ielts-academic-essays%2Fpie-charts-below-show-electricity-generation-source-new-1&psig=AOvVaw0UX4mDRTmmxnXLp-zoQZ5Z&ust=1576296680950864
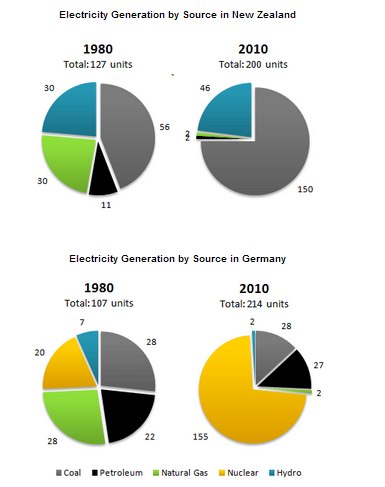
. Overall, there was an upward trend in the total electricity production in both countries. Additionally, electricity production units from coal in New Zealand registered the highest figure in 2010, while the amount of electricity produced from nuclear power recorded the highest data in the same year.
In 1980, NZ harnessed more than half coal for electricity, which doubled the figure for Germany, at 28 units. A similar pattern was exhibited in the data for petroleum in NZ and G, at 22 units and 11 units respectively. Meanwhile, Nz derived about 30% of its electricity from Hydro and Natural gas, while in Germany, the number of electricity units produced from natural gas was 4 times as much as the figure for Hydro, at 28 units and 7 units respectively. Electricity production from nuclear constituted 20 units in the supply in Germany.
In 2010, most electricity generated in NZ come from coal, at 150 units. Meanwhile, the energy came from nuclear contributed to 155 units for the electricity production in G. In contrast, natural gas was minimally harnessed for electricity generation in both countries, at 2 units. The amount of electricity production from hydro took up 46 units, which was 44 units higher than that of its counterpart. In particular, the number of electricity generation ranged from a lower of 2 units in 1980 to a high of 27 units in 2010.
Get the Weekly English Kit 📬
New words, one handy idiom, and a 2-minute quiz — delivered to your inbox to keep your streak alive.
 Related Questions