
WRITING TASK 1. PLEASE HELP ME CHECK MY NEW ESSAY! THANK YOU!
The line graph shows burglaries per thousand vehicles in four countries between 2000 and 2009.
Summarize the information by selecting and reporting the main features, and make comparisons where relevant.
The line graph reports how many cases of burglaries per thousand among the four countries, namely, Great Britain, Greece, Spain, and Norway over a period of nine years, from 2000 to 2009.
Overall, Great Britain had its thievery proportions the highest of the four countries, while Norway had the smallest of that. Greece and Norway had an upward trend, Great Britain and Spain experienced a downward trend.
The number of reported cases of stealing in Great Britain began at nearly 16 and stayed stable from 2000 to 2005 before the figure rose steadily to 20 thousand cases in 2002. In 2004, there was a precipitous drop in thievery (15) prior to reaching a peak of 20 thousand cases of burglaries again in 2006. After 2006, the number of thieving kept falling to 15 thousand and stayed there till 2009. On a reverse trend, Greece had its figure increased stability from approximately 7 in 2000, to reach a peak in the last year, at approximately 14.
Spain and Norway had never surpassed 10 thousand cases from 2000 to 2009. To be more specific, in 2000, Norway and Greece ranked third (about 7) and fourth (about 6), respectively. While Norway had its figure plummeted to 5 thousand in 2003 and stayed unchanged until 2007, the burglaries of Spain had a sharp increase to hit a peak of nearly 8 in 2005 following by a dramatic reduction to reach a low point about 4 thousand in 2009. From 2007 to 2008, there was a slight increase in the number of cases in Norway. After the year, it stayed remained until the la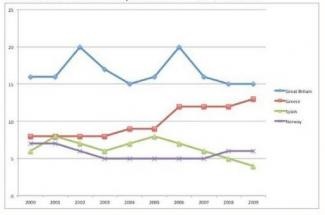
Top answer
Please post essays, paragraphs, dialogues and other writing in the essay forum so a moderator does not have to move your post. htm Also, I cannot make out anything in that image. It is of very poor quality.
- Please post essays, paragraphs, dialogues and other writing in the essay forum so a moderator does not have to move your post.
- htm Also, I cannot make out anything in that image.
- It is of very poor quality.
- Please attach a better one.
- You did not post a complete essay.
Get the Weekly English Kit 📬
New words, one handy idiom, and a 2-minute quiz — delivered to your inbox to keep your streak alive.
Please post essays, paragraphs, dialogues and other writing in the essay forum so a moderator does not have to move your post.
https://www.englishforums.com/English/EssayReportCompositionWriting/Forum9.htm
Also, I cannot make out anything i
The line graph shows burglaries per thousand vehicles in four countries between 2000 and 2009.
Summarize the information by selecting and reporting the main features, and make comparisons where relevant.
The line graph reports how many cases of burglaries per thousand among the four countries, namely, Great Britain, Greece, Spain, and Norway over a period of nine years, from 200
 Related Questions