
Writing task 1! Please help me check and correct
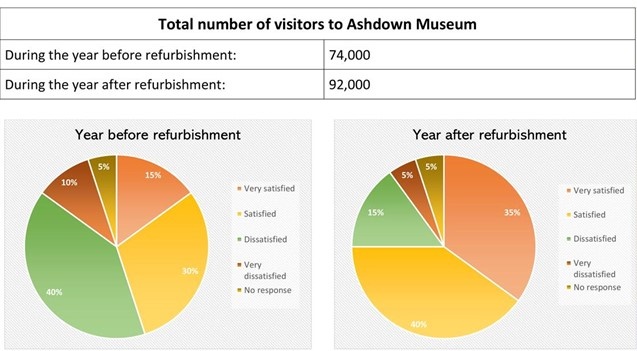
Topic: The table below shows the numbers of visitors to Ashdown museum during the year before and the year after it was refurbished. The charts show the result of surveys asking visitors how satisfied they were with their visit, during the same two periods.
Summarize the information by selecting and reporting the main features, and make comparisons where relevant.
The established table and pie chart give the data of people stopping with Ashdown museum during the year preceding and following its renovation. The table compares figures for visitors to Ashdown Museum, while the graph displays visitors’ overview about their destination.
Overall, the redecoration of Ashdown Museum brought positive effects, with both the significant increase in number of visitors, growing from 74,000 to 92,000 people, and higher level of satisfaction.
To be more specific, in the duration of the year before the refurbishment of Ashdown Museum, the total proportion of visitors who were dissatisfied and very dissatisfied was 5% higher than that of contented and jubilant people, with unsatisfied tourists accounting for the largest number, at 40%.
After the refurbishment, the pattern for very pleased visitors sharply rose up to 35% compared to 15% of people with the same feeling in the year before the renovation. The number of those who were satisfied did, in a similar way, increase by 10%. Whereas, there was a dramatic drop in the figures for unpleased and awfully disappointed tourists.
Top answer
The established (wrong word) table and pie chart give the data of people stopping with (wrong phrase) Ashdown museum during the year preceding and following its renovation. The table compares figures (wrong word) for visitors to Ashdown Museum, while the graph (wrong word) displays visitors’ overview about their destination. (wrong description) Overall, the redecoration (wrong word) of Ashdown Museum brought positive effects, with both a the significant increase in number of visitors, growing from 74,000 to 92,000 people , and a higher level of satisfaction.
- The established (wrong word) table and pie chart give the data of people stopping with (wrong phrase) Ashdown museum during the year preceding and following its renovation.
- The table compares figures (wrong word) for visitors to Ashdown Museum, while the graph (wrong word) displays visitors’ overview about their destination.
- (wrong description) Overall, the redecoration (wrong word) of Ashdown Museum brought positive effects, with both a the significant increase in number of visitors, growing from 74,000 to 92,000 people , and a higher level of satisfaction.
- To be more specific, in the duration (wrong word) of the year before the refurbishment of Ashdown Museum, the total proportion of visitors who were dissatisfied and very dissatisfied was 5% higher than that of contented and jubilant (wrong word) people, with unsatisfied tourists accounting for the largest number, at 40%.
- After the refurbishment, the pattern for very pleased (wrong word) visitors sharply rose up to 35% compared to 15% of people with the same feeling in the year before the renovation.
Get the Weekly English Kit 📬
New words, one handy idiom, and a 2-minute quiz — delivered to your inbox to keep your streak alive.
The established (wrong word) table and pie chart give the data of people stopping with (wrong phrase) Ashdown museum during the year preceding and following its renovation. The table compares figures (wrong word) for visitors to Ashdo
 Related Questions