
Writing task 1: Please help me by reviewing this essay. Thank you.
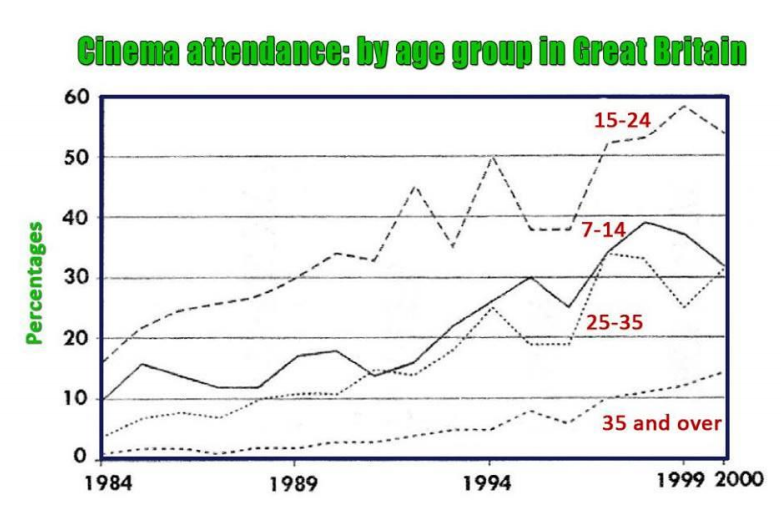
The line graph gives information about the percentage of people attending cinema in Great Britian over the period from 1984 to 2000 by four age groups including those from 7 to 14, 15 to 24, 25 to 35 and over 35.
Overall, there was an increase in the proportion of cinema attendance in each age group despite some fluctuations. People aged from 15 to 24 years old showed their interest in movies the most in contrast to those in the ages of 35 and onwards.
It is clear that at the beginning, below 1% pf people whose ages were over 35 went to cinema, in comparison with 4% of 25-to-35 people. Those in the age from 15 to 24 years old held the first rank with 16%, followed by 10% of people in the age group from 7 to 14.
In spite of some obvious variations, the proportion for attendants who were from 15 to years old kept going up, reaching the peak of approximately 60% in 1999 before going down to 53% in 2000. Similarly, throughout the period, while the percentage of 7-to-14 attendants got the highest point in 1998 with 39% and then decreased to 32%, that of people in the age from 25 to 35 years old topped at 34% before decreasing to the same percentage as that of teenage attendants (7 to 14 years old). There was a steady growth in the percentage of people going to cinema to watch TV, up to 14% in the last year shown.
Thanks for your help <3
Top answer
The line graph shows trends for ..... , divided into four age groups, 7 to 14, 15 to 24, 25 to 35 and 35 plus. t2%3B%2Cgraph%20%2A%20trends%3B%2Cc0%3B%2Cs0%3B%3Bgraph%20shows%20trends%3B%2Cc0%3B%3Bgraph%20showing%20trends%3B%2Cc0 Despite some fluctuations, there was a general increase in the proportion of cinema attendance in each age group .
- The line graph shows trends for .....
- , divided into four age groups, 7 to 14, 15 to 24, 25 to 35 and 35 plus.
- t2%3B%2Cgraph%20%2A%20trends%3B%2Cc0%3B%2Cs0%3B%3Bgraph%20shows%20trends%3B%2Cc0%3B%3Bgraph%20showing%20trends%3B%2Cc0 Despite some fluctuations, there was a general increase in the proportion of cinema attendance in each age group .
- [more balanced word order] 'showed their interest in movies': a somewhat 'colored' description: 'had the highest attendance' would be more objective.
- 'the most, whereas those aged 35 plus showed/had the least'.
Get the Weekly English Kit 📬
New words, one handy idiom, and a 2-minute quiz — delivered to your inbox to keep your streak alive.
The line graph shows trends for ..... , divided into four age groups, 7 to 14, 15 to 24, 25 to 35 and 35 plus.
The line graph plots gives information about the percentage of people in four age groups who attended attending cinema in Great Britian over the period from 1984 to 2000. The age groups includ
 Related Questions