
Writing task 1 . Please help me
The line chart compares the number of books read by men and women at burnaby public library between 2011 and 2014.
Looking at the line charts, it is immediately obvious that both grapps have changed over the given period and the number of books read by men more than by women
In 2011, the number of books read by women was highest, at 4000 books, while the figure for men was significantly lower, about 2000 books. The number of books read by men and women continued to rise, especially, the figure for men rose dramatically. In 2013, the number of books read by men and women became balance, at 10000 books. After one year, the books read by women reduced suddently, around to 8000 books. Meanwhile, the books read by men increased sharply and reached peak about 140000 books and becam the highest in entire chart.
Overall, there was a strong upward trend in the number of books read by men. Although women read more book than men in 2011 year, their reading fell to below the level of men in 2010 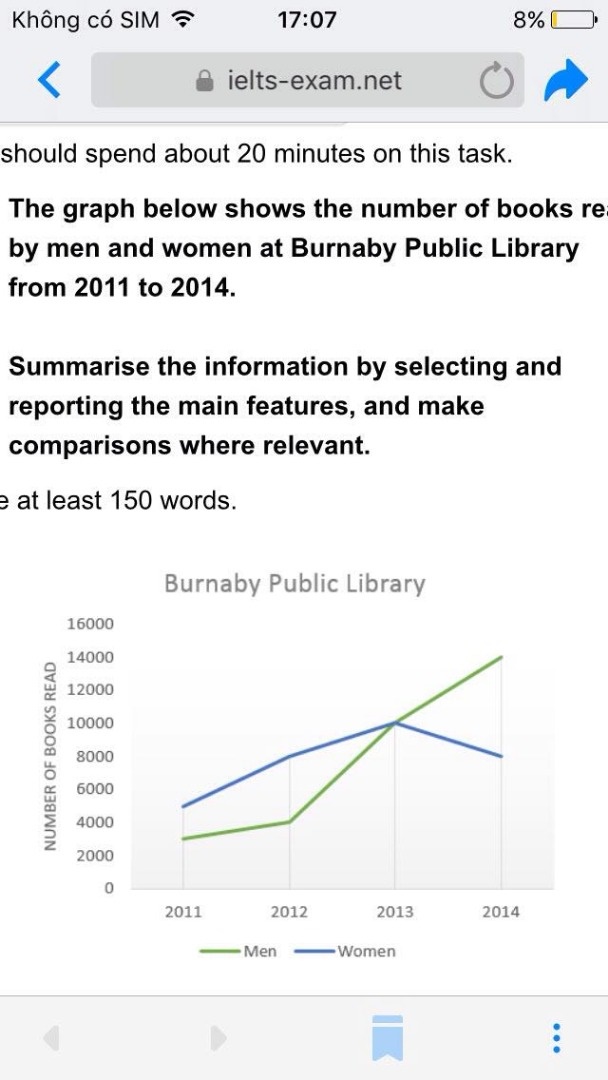
Top answer
The line chart compares the number of books read by men and women at bu rnaby p ublic lib rary between 2011 and 2014. ) it is immediately obvious that both grapps have changed (Did the graph change? No.
- The line chart compares the number of books read by men and women at bu rnaby p ublic lib rary between 2011 and 2014.
- ) it is immediately obvious that both grapps have changed (Did the graph change?
- No.
- ) over the given period and the number of books read by men (missing word) more than (missing words) by women (missing punctuation) In 2011, the number of books read by women was highest , (The superlative is for 3 or more.
- ) at 4000 books, while the figure for men was significantly lower, about 2000 books.
Get the Weekly English Kit 📬
New words, one handy idiom, and a 2-minute quiz — delivered to your inbox to keep your streak alive.
The line chart compares the number of books read by men and women at burnaby public library between 2011 and 2014.
Looking at the line charts, (There is only one chart.) it is immediately obviou
 Related Questions