
Writing task 1. Please help me
Please help me. Give me some advice and a score . I know myself have mistake and i hope become a better one day. Thanks for your help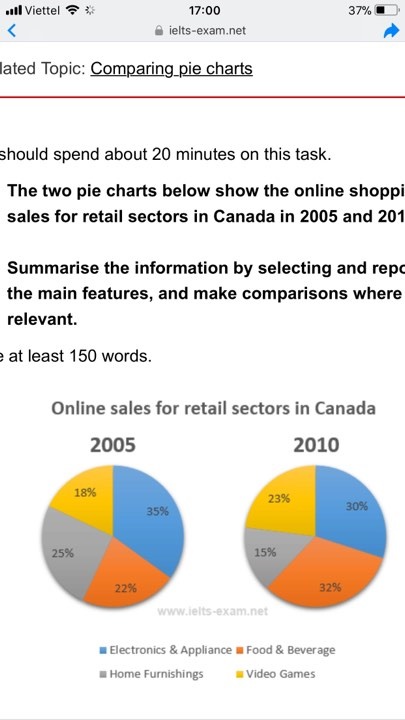
The pie charts provides a breakdown of the online shopping sales for retail sectors between 2005 and 2010 in Canada.
Looking at the pie chart, it is immediately that in 2005, consumer bought many electronics and appliance. The food and beverage was most consumed in 2010.
In 2005, the percentage of trade on electronic and appliance was highest at 35%, while the figure for food and beverage was significantly lower at 22%. By contrast this, the rate of selling on Food and Beverage went up by 10% to 32% and became the biggest level in the charts. Besides, there was a slight decrease in the rate of selling on electronic and appliances by 5% to 30%. Meanwhile, the video game and home furnishings were made up 18% and 25 % respectively. Aftet 5 year the video game's marginally increase by 5%. the proportion of vend on home furnishings downward by 10% to 15%
Top answer
The pie charts provides a breakdown of the online shopping sales {1} for {1} retail sectors between for 2005 and 2010 in Canada. Looking at the pie chart s , it is immediately apparent that in 2005, Canadian consume rs [ a] bought many {1} electronics and appliance s [ a] than other types of retail items, [ b ] {1} The food and beverage [ a] was most consumed represented the largest {1} in 2010. In 2005, the percentage of trade on online {1} of electroni c s [ a] and applianc e s [ a] was highest at 35%, while the figure for food and beverag e s [ a] was significantly lower at 22%.
- The pie charts provides a breakdown of the online shopping sales {1} for {1} retail sectors between for 2005 and 2010 in Canada.
- Looking at the pie chart s , it is immediately apparent that in 2005, Canadian consume rs [ a] bought many {1} electronics and appliance s [ a] than other types of retail items, [ b ] {1} The food and beverage [ a] was most consumed represented the largest {1} in 2010.
- In 2005, the percentage of trade on online {1} of electroni c s [ a] and applianc e s [ a] was highest at 35%, while the figure for food and beverag e s [ a] was significantly lower at 22%.
- By contras t, this, the rate of selling on {1} sales of f ood and b everag e s [ a] [ c ] went up by 10% to 32% and became the biggest largest [ d ] level {1} in 2010, whereas the charts.
- Besides, there was a slight decrease of 5% in the rate of selling on electroni c s [ a] and appliances by 5% which went down to 30% in 2010 .
Get the Weekly English Kit 📬
New words, one handy idiom, and a 2-minute quiz — delivered to your inbox to keep your streak alive.
The pie charts provides a breakdown of the online shopping sales {1} for {1} retail sectors between for 2005 and 2010 in Canada.
Looking at the pie charts, it is immediately apparent that in 2005,
 Related Questions