
Writing task 1 - Please give me some advice on this task
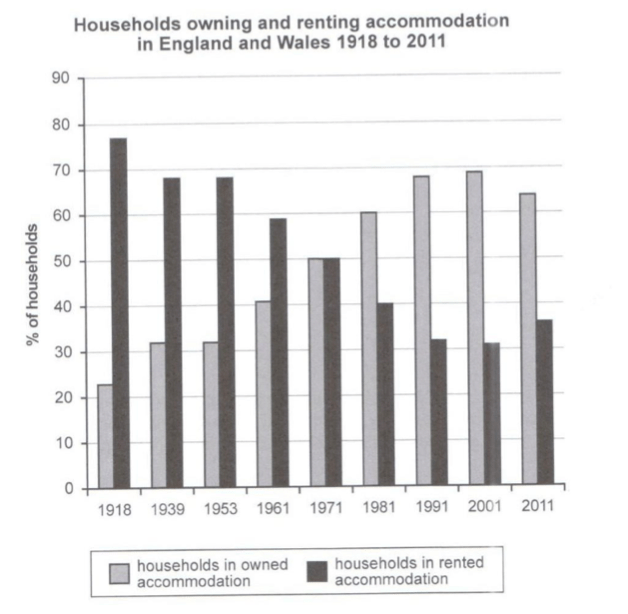
The chart below shows the percentage of households in owned and rented accommodation in England and Wales between 1918 and 2011.
The bar chart compares the percentage of families in possed and rented accommodation in England and Wales from 1918 to 2011
Overall, during the first half of the period, households’ preferences for rented accommodation were higher than the preferences of owned accommodation, while the opposite trend was observed for over the final 30 years.
In 1981, ownership accounted for just nearly 25% compared to rentals, which were over 75%. From that point, there was a stable decline in rental and a rise in ownership. The rental was 69% in 1939 and hold the proportion in 1953 before falling to 1961 and being even with ownership’s proportion in 1971. Ownership had a steady rise in 1939 and 1953 at over 30% and had a difference in growth is 10% from 1961 [40%] to 1971 [50%].
From 1981 to 2011, ownership continued its rising trend to reach a peak of nearly 70% before dropping in 2011 by 5%. The proportion of tenant had an opposite pattern, falling in 1981 at 40% and dropping nearly by 10% in 1991 and 2001, followed by a small rise of 5% in 2011.
Top answer
The bar chart compares the percentage of families in [ 1] possed owner-occupied and rented accommodation in England and Wales from 1918 to 201 1. Overall, during the first half of the that period, households’ the p referenc e for rented accommodation were was higher than the preferences of for owned accommodation, while the opposite trend was observed for over the final 30 years. In [ 2] 1918, 1981, ownership owned accommodation accounted for just nearly under 25% compared to rentals, which were over 75%.
- The bar chart compares the percentage of families in [ 1] possed owner-occupied and rented accommodation in England and Wales from 1918 to 201 1.
- Overall, during the first half of the that period, households’ the p referenc e for rented accommodation were was higher than the preferences of for owned accommodation, while the opposite trend was observed for over the final 30 years.
- In [ 2] 1918, 1981, ownership owned accommodation accounted for just nearly under 25% compared to rentals, which were over 75%.
- From that point, there was a stable decline in rental and a rise in ownership.
- The rental was former decreased to 69% in 1939 and hold the proportion remained at that level in 1953 before falling to just under 60% in 1961 and equaling the being even with ownership’s proportion of owned homes in 1971.
Get the Weekly English Kit 📬
New words, one handy idiom, and a 2-minute quiz — delivered to your inbox to keep your streak alive.
The bar chart compares the percentage of families in [ 1] possed owner-occupied and rented accommodation in England and Wales from 1918 to 2011.
Overall, during the first half of the that period, households’
 Related Questions