
[Writing Task 1] Please give feedback on my writing
Pic
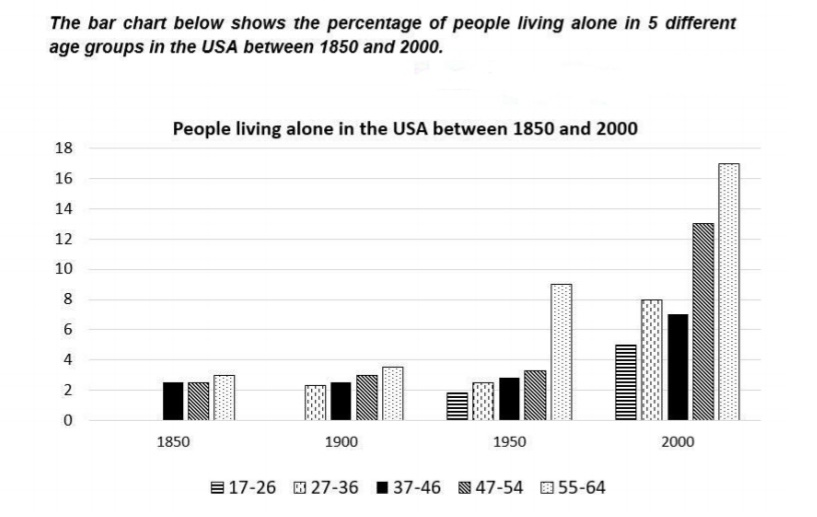
The bar chart given reveals the percentage of USA citizens with a solitary lifestyle in 5 different age groups from 1850 to 2000.
Overall, all 5 groups experienced the upward trend, among which the percentage of the group of elderly people living on their own was always the highest compared to the other categories.
In 1850, the figures of the two 37-46 and 47-54 categories were the same at 2.5 percent. After 50 years, the difference between these two groups was 0.5 percent and remained unchanged until 1950. In 2000 the percentages of the 37-46 and 47-54 groups was 7 and 13 percent respectively. The number of residents over 55 living alone did not vary much for the first two marks of the period, then rocketed to 17 percent in 2000.
For 1900 and 1950, new age groups were added. The data of the 27-36 proportion remained stable until 1950, then doubled in 2000. There were the least number of that aged between 17-26 living alone during the period, which increased by 3 percent from 1950 to 2000.
Top answer
Did you read my previous advice? I don't think so. Do I need to repeat it?
- Did you read my previous advice?
- I don't think so.
- Do I need to repeat it?
- Here it is: 1.
- In a math/science context, a figure is a table, diagram or other graphic inserted in the text.
Get the Weekly English Kit 📬
New words, one handy idiom, and a 2-minute quiz — delivered to your inbox to keep your streak alive.
Did you read my previous advice? I don't think so.
Do I need to repeat it? Here it is:
1. In a math/science context, a figure is a table, diagram or other graphic inserted in the text. It refers to numeric values only in a business performance context. Avoid the word "figure" in Task 1.
2. Avoid the verbs "see, witness, experience" in Task 1.
 Related Questions