
[Writing Task 1] Please give feedback on my writing
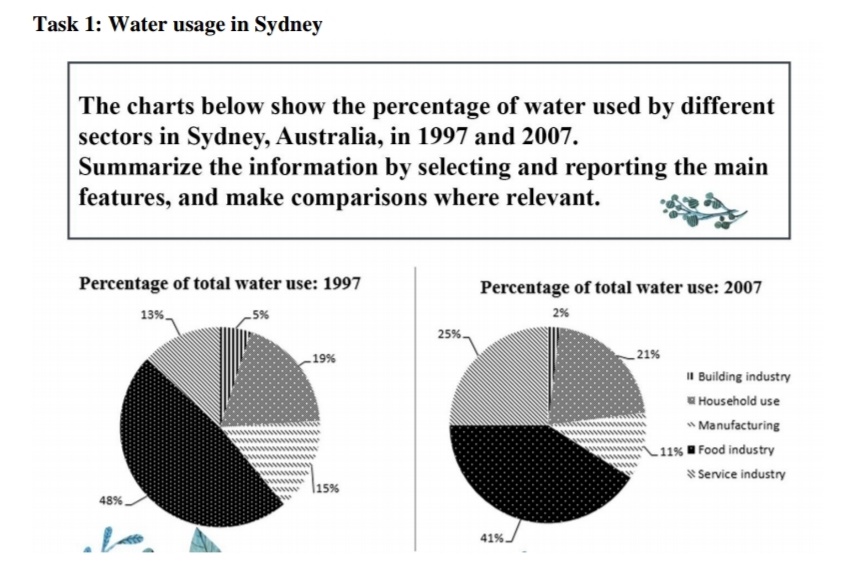
The pie charts given compare the data of water usage by five categories in Sydney, Australia of 1997 and of 2007. Overall, the food industry took up the largest portions of the charts - nearly half of the total water use.
There was a dip in the amount of water used for the building industry, the manufacturing and the food industry. The percentage of food industry decreased from approximately 50 percent in 1997 to 41 percent ten years later. Whereas in 1997 the building industry made use of 5 percent of the whole amount, by 2007 this number was reduced to 2 percent. For manufacturing, the percentage dropped by 4 percent.
Compared to the mentioned three sectors, the statistics of household use and service industry experienced the opposite trend. After ten years the demand for water for services doubled, reached a quarter of total use in 2007, while domestic use required only 2 percent more than in 1997.
WRITE DESCRIPTION HERE
Top answer
) in Sydney, Australia of 1997 and of 2007. Overall, the food industry took up the largest portions of the charts, nearly half of the total water use . (This sentence does not belong in paragraph #1.
- ) in Sydney, Australia of 1997 and of 2007.
- Overall, the food industry took up the largest portions of the charts, nearly half of the total water use .
- (This sentence does not belong in paragraph #1.
- In the first paragraph, only describe the figure and its aspects such as subject matter, units of measure, categories, time frame and places.
- In the second paragraph, write about the two or three most important observations.
Get the Weekly English Kit 📬
New words, one handy idiom, and a 2-minute quiz — delivered to your inbox to keep your streak alive.
The pie charts given compare the data of water usage by five categories (What are these categories?) in Sydney, Australia of 1997 and of 2007. Overall, the food industry took up the largest portions of the charts, nearly half of the total water use. (This sentence does not belong in paragraph #1. In the first paragraph, only des
 Related Questions