
Writing task 1-number 9
Here is my essay. Could you please correct it for me. I just have 3 weeks left before the exam.  . Thanks a lot.
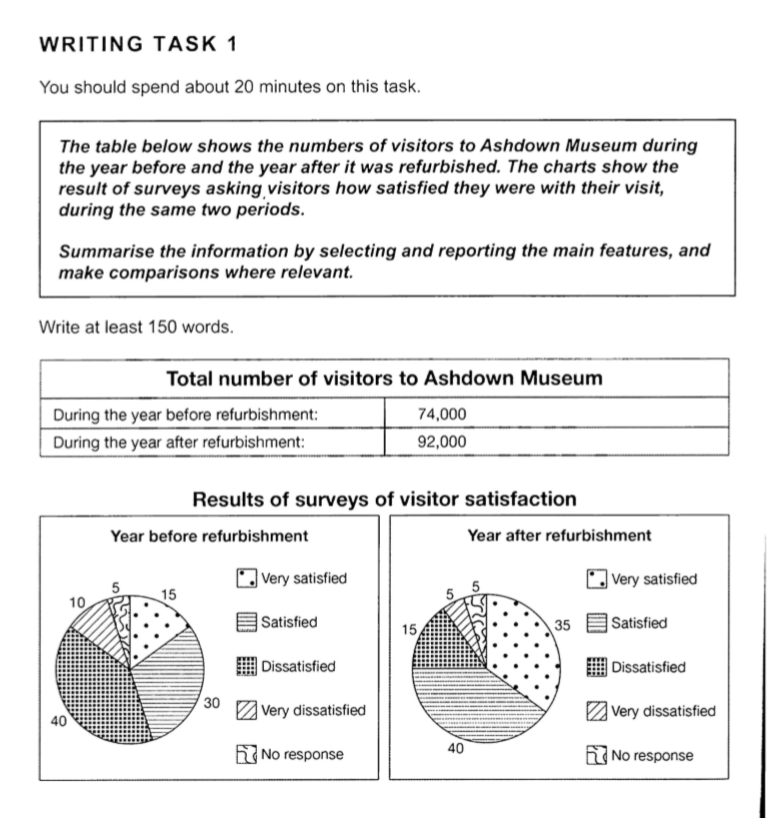
The chart shows how many visitors came to Ashdown Museum before and after its refurbishment, while the charts compare the result of surveys of visitors satisfaction with their visit in the same periods. Overall, after being refurbished, Ashdown Museum attracted more visitors and increased their satisfaction.
Looking at the table, we can see that the number of visitors significantly increased to 92.000 after refurbishment from 74.000 during the year before development.
Moving on to the charts, it is clear that the percentage of visitors who were very satisfied with their visit showed a dramatic increase of 20% after refurbishment, reaching 35%, compared to 15% before the development. 40% of total visitors to Ashdown Museum said they felt satisfied with their visit when the museum had been refurbished, increasing from under a third before the change. In contrast, the number of dissatisfied visitors during the year after development showed a dramatic decline, standing at 15%, compared to 40% before the museum had been refurbished. In the same time, a twofold decrease was seen in the percentage of very dissatisfied visitors. Meanwhile, there was no change in the number of visitors who had no response when being asked about their satisfaction before and after Ashdown Museum's development, standing at 5% during two periods.
Top answer
Here is my essay. Could you please correct it for me. I just have 3 weeks left before the exam.
- Here is my essay.
- Could you please correct it for me.
- I just have 3 weeks left before the exam.
- Thanks a lot.
- The chart (It is not a chart.
Get the Weekly English Kit 📬
New words, one handy idiom, and a 2-minute quiz — delivered to your inbox to keep your streak alive.
Here is my essay. Could you please correct it for me. I just have 3 weeks left before the exam. . Thanks a lot.
The chart (It is not a chart. Use the exact name for it.) shows how many visitors came to Ashdown Museum before and after its refurbishment, while the (missing word - what kind of chart is it?) charts compare the resu
 Related Questions