
WRITING TASK 1-NUMBER 7
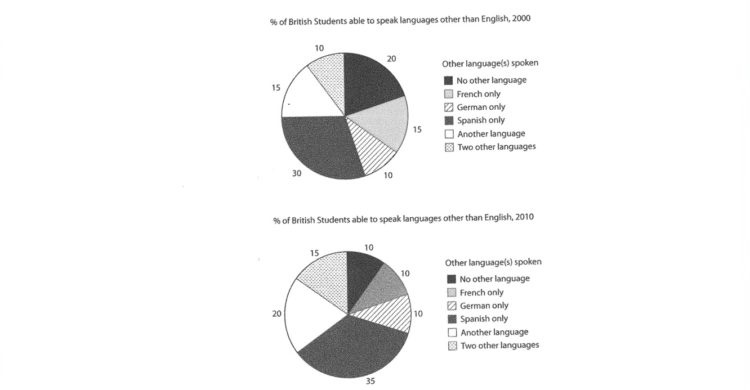
The charts below show the proportions of British students at one university in England who were able to speak other languages in addition to English, in 2000 and 2010.
Here is my essay. I hope you can correct it for me. Thanks a lot.
The pie charts illustrate the percentages of British students at an English university who had ability to speak other languages besides English, in two different years: 2000 and 2010. Overall, the most striking feature is that the proportions of those who were able to speak Spanish were highest in both years.
The number of British students speaking German was equal to that of those speaking two other languages, at 10% in 2000. However, the latter increased to 15% in 2010, while the former still stood at 10%. The percentage of British students who were able to speak French was the same that of those speaking another language, at 15% in 2000. But these two figures then had opposite trends ten years later. While the figure of British students speaking French showed a downward trend, declining to 10% in 2010, the proportion of those who had ability to speak another language experienced an upward trend, increasing to 20%. The number of those who spoke English only accounted for 20% in 2000. This figure then halved in 2010. Finally, the percentage of British students who could speak Spanish slightly increased from 30% in 2000 to 35% in 2010, making Spanish the most commonly spoken language.
Top answer
The pie charts are extremely difficult to see. My comments are based on these numbers. Language / year 2000 2010 No other language 30 35 Spanish Only 20 10 French Only 15 10 German only 10 10 Another language 15 20 Two other languages 10 15 The pie charts show the percentages of British students at an English university who had ability to speak other languages besides English, (no comma) in two different years : (comma) 2000 and 2010.
- The pie charts are extremely difficult to see.
- My comments are based on these numbers.
- Language / year 2000 2010 No other language 30 35 Spanish Only 20 10 French Only 15 10 German only 10 10 Another language 15 20 Two other languages 10 15 The pie charts show the percentages of British students at an English university who had ability to speak other languages besides English, (no comma) in two different years : (comma) 2000 and 2010.
- Overall, the most striking feature is that the proportions of those who were able to speak Spanish were highest in both years.
- ) In 2000, t he number of British students speaking German was equal to that of those speaking two other languages, at 10% in 2000 .
Get the Weekly English Kit 📬
New words, one handy idiom, and a 2-minute quiz — delivered to your inbox to keep your streak alive.
 Related Questions