
Writing task 1- number 1
Here is my essay. I hope you can correct it for me. Thanks a lot.
The graph below compared the amount of goods carried by four categories of modes of transport
In the UK from 1974 to 2002.
It is clear that the total amount of goods in the UK increased over the period, but the figured for the road was the highest.
In 1974 the merchandise transported by the road was about 70 million tonnes, which was much higher than that of water and rail, at about 40 million tonnes. Just over 5 million tones came from pipeline. From 1974 to 1994, the figures for the road and rail fluctuated and both dipped in 1994, at nearly 80 and 30 million tonnes respectively. Over the same period, the water and pipeline increased gradually.
Throughout the remainder of the period, there was a dramatic increase in the amount of merchandise transported by the road, water and rail , at nearly 100, 65 and about 40 million tonnes in respective. While the figures for the pipeline remained unchanged, at abo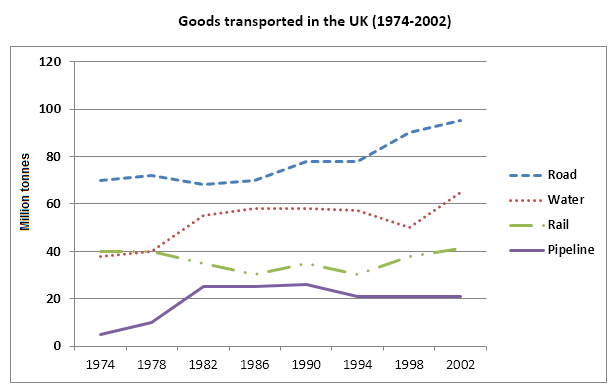
ut 22 million tonnes.
Get the Weekly English Kit 📬
New words, one handy idiom, and a 2-minute quiz — delivered to your inbox to keep your streak alive.
 Related Questions