
Writing Task 1 - Line Graph Practice 2nd-May-18
The line graph shows the changing patterns of hours used for three different TV programs namely films and drama, news and weather in comparison with sports throughout a period of 40 years from 1982.
It is explicitly observed that the hours spent on movie programs and public affairs including news and weather are by far the longest time for the country people. In sharp contrast, the time spent on sports programs, a distant third, showing an opposite trend with negligible variations over the time frame.
In 1982, the hours in movie programs and public affairs stood at just under 1.5 and 2 hours respectively, compared with merely half an hour of sports. 2012 experienced a significant bounce to 5.7 hours spent on movie watching, before seeing a 10-year period of stagnation. At this time, the time for news and weather leapt up 2.5 times as much as 5 hours since 1982. The hours spent on cinema and public affairs are projected to nearly coincide a common figure of 5.7 hours in 2022.
After experiencing an erratically negligible fluctuations during the time shown, the number of hours spent on watching sports shows is projected to reach about 0.7 hours in 2022.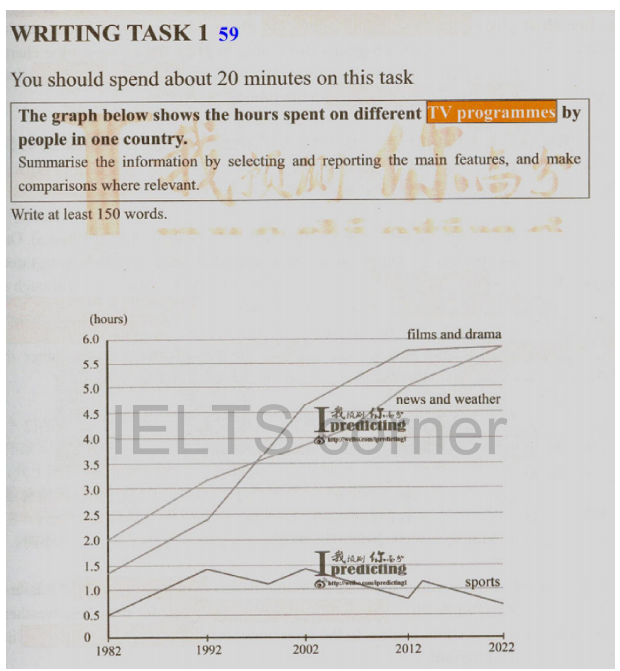
Top answer
org/dictionary/english/program
- org/dictionary/english/program
Get the Weekly English Kit 📬
New words, one handy idiom, and a 2-minute quiz — delivered to your inbox to keep your streak alive.
CharliePhanTV programs namely films
Films/movies https://dictionary.cambridge.org/dictionary/english/film are not programs/programmes which are a https
The line graph shows the changing patterns of the times people spent watching hours used for three different TV programs, namely films and drama, news and weather,
 Related Questions