
Writing task 1 - Line graph. Help me, please. Thanks !!!
The graph shows the amount of money spent on books in Germany, France, Italy and Austria between 1995 and 2005. Summarize the information by selecting and reporting the main features, and make comparisons where relevant.
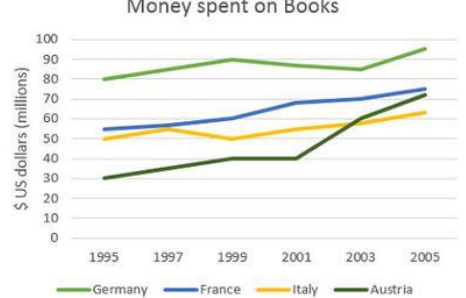
The line graph illustrates the proportion of money expenditure on books in four different countries from 1995 to 2005.
Overall, it is clear that the trends of four countries increased. However, the figure for Germany was higher than the other money spent almost all the time surveryed.
In 1995, the amount of money expenditure on books in Germany highest, exactly 80 million dollars , while about 55 million dollars in France and 50 million dollars in Italy. By contrast, the money spent on books in Austria was lowest, exactly 30%.
The year 2005 saw a dramatic rise in the amount of money spent on books in Austria, it reached to over 70 million dollars . In the same year, the money spent on books in France was high, compared to Italy, about 75 and over 50 million dollars respectively. Despite some minor fluctuations, the figure for money spent on books in Germany was highest, it rose a peak of about 97 million dollars in 2005.
Top answer
The graph shows the amount of money spent on books in Germany, France, Italy and Austria between 1995 and 2005. Summarize the information by selecting and reporting the main features, and make comparisons where relevant. The line graph illustrates the proportion (wrong word.
- The graph shows the amount of money spent on books in Germany, France, Italy and Austria between 1995 and 2005.
- Summarize the information by selecting and reporting the main features, and make comparisons where relevant.
- The line graph illustrates the proportion (wrong word.
- ) of money expenditure (wrong phrase) on books in four different countries from 1995 to 2005.
- Overall, it is clear that the trends of four countries ( wrong usage) increased.
Get the Weekly English Kit 📬
New words, one handy idiom, and a 2-minute quiz — delivered to your inbox to keep your streak alive.
The graph shows the amount of money spent on books in Germany, France, Italy and Austria between 1995 and 2005. Summarize the information by selecting and reporting the main features, and make comparisons where relevant.
The line graph illustrates the proportion (wrong word. Proportions are numbers less than 1.) of
 Related Questions