
Writing task 1 line graph and table
Hi guys, I'm new user, I hope you guys can check this essay for me!Thanks a lot!!!!!
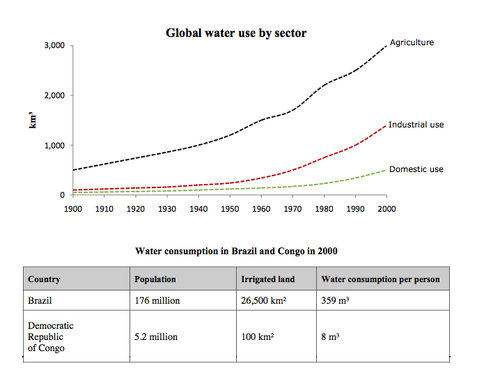
The line graph illustrates the amount of water used worldwide from 1900 and 100 years later in three main areas, namely agriculture, industrial use and domestic use and the table presents water consumption in two countries, Brazil and Democratic Republic of Congo.
According to the graph, agriculture seem to consume the quantity of water at highest level as 500 km3 were used in 1900 and this figure increased drastically to approximately 3000km3 in 2000. The amount of water expenditure in industrial and domestic sector was on nearly the similar trend in a hundred years (1900 – 2000). Both areas used a tiny volume of water, at around 30 – 40 km3 in 1900 and the number just rose slightly in a half of a century. However, from 1950 onward, water consumption in these fields grew steadily, at over 1000 km3 and approximately 300 km3 respectively in 2000.
It is clearly seen from the table that the population of Brazil was 176 million people, which over 100 million people higher than Democratic Republic of Congo’s. While just 26,500 km2 of irrigated lands belonged to Brazilian, Democratic Republic of Congo accounted for 100 km2 arming fields. Another noticeable figure was the consumption per person in both nations. Each Brazilian used 359 m3, which were about 50 times as much as inhabitants of Congo consumed.
Overall, agriculture was the field using the largest quantity of water in compare with the others and the water consumption in Brazil was much higher than in Democratic Republic of Congo.
Top answer
The line graph illustrates the amount of water used worldwide from 1900 and 100 years later (Bad English. The best phrases are "from 1900 to 2000" or "between 1900 and 2000" ) in three main areas, namely agriculture, industrial use and domestic use. and T he table presents water consumption in two countries, Brazil and Democratic Republic of Congo.
- The line graph illustrates the amount of water used worldwide from 1900 and 100 years later (Bad English.
- The best phrases are "from 1900 to 2000" or "between 1900 and 2000" ) in three main areas, namely agriculture, industrial use and domestic use.
- and T he table presents water consumption in two countries, Brazil and Democratic Republic of Congo.
- ) According to the graph, agriculture seem to consume ("Seem" means that you re not sure about what is on the graph.
- ) the quantity of water at (missing word) highest level (missing punctuation) as 500 km3 were used in 1900 and this figure increased drastically to approximately 3000km3 in 2000.
Get the Weekly English Kit 📬
New words, one handy idiom, and a 2-minute quiz — delivered to your inbox to keep your streak alive.
The line graph illustrates the amount of water used worldwide from 1900 and 100 years later (Bad English. The best phrases are "from 1900 to 2000" or "between 1900 and 2000" ) in three main areas, namely agriculture, industrial use and domestic use. and The table presents water consumption in two countries, Brazil and D
 Related Questions