
Writing task 1-Line graph
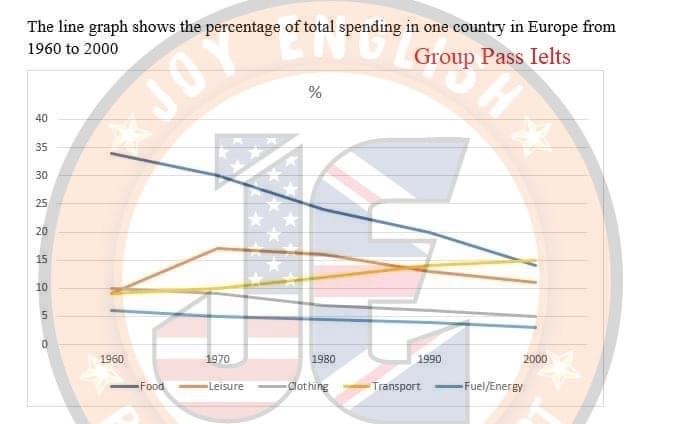
The line graph illustrates the proportion of total expenditure on five different categories in one country of Europe between 1960 and 2000.
Overall, the proportion of spending on Food declined substantially, while the amount of expenditure on Transport throughout four decades. The percentage of leisure expenses remained relatively stable after 40 years.
In 1960, the percentage of spending on Food was the highest, at approximately 35%, while expenditure on Transport was much lower, at about 9%. Over the 40 following years, there was a steady increase in the proportion of spending on Transport to 15%. In contrast, Food expenses dropped considerably by 16% at the same time.
The proportion of spending on Leisure, Clothing, and Fuel/Energy began relatively low, at 9%, 10%, and 6% respectively in 1960. Spending on Leisure increased steadily to roughly 18% in 1970 after gradually decreasing to 11% in 2000. In the meantime, there were slight decreases to 5% and 4% in expenditure on Clothing and Fuel/Energy respectively.
Get the Weekly English Kit 📬
New words, one handy idiom, and a 2-minute quiz — delivered to your inbox to keep your streak alive.
 Related Questions