
Writing task 1. Keep going ^^. Please help my mistake. Tks
The table chart provides a breakdown of the amount of natural gas consumption and production in different countries in 2001.
Overall, the USA had most popular in consumption and production of natural gas, which had very a little in New Zealand. Besides, the production of other countries was higher than their consumption, with the exception of the former Soviet Union.
In terms of consumption, the USA’s consumption was highest, at 588.9 million, while the figure for United Kingdom was significantly lower, at 86.1 million, which was three times that of United Arab Emirates, at 30 million. 68.6 million of gas used in Japan compared to 24.3 million in China. Australia and Korea share the virtual equal amount of gas consumption, around 19 million. Meanwhile, New Zealand and Soviet Union was lowest in consumption, 4.9 million and 7.1 million respectively.
On the other hand about production, the USA was a largest producer with a creation of gas in 2001, at 500 million tonnes, which was around five times that the figure for UK and twenty times that of Chinna. The Aus and United A.E. produced from 25 million to 36 million respectively. Whereas, production of gas was not popular in Soviet.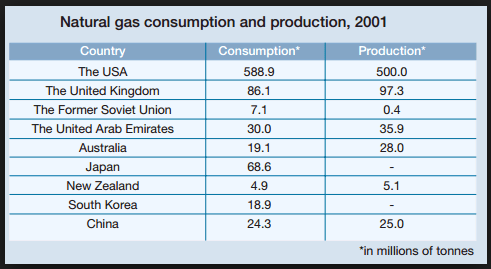
Top answer
The table chart (There are pie charts and bar charts. There is no such thing as a table chart. ) provides a breakdown (wrong word) of the amount of natural gas consumption and production in different countries in 2001.
- The table chart (There are pie charts and bar charts.
- There is no such thing as a table chart.
- ) provides a breakdown (wrong word) of the amount of natural gas consumption and production in different countries in 2001.
- Overall, the USA had most popular (wrong word.
- Popular means that people like it.
Get the Weekly English Kit 📬
New words, one handy idiom, and a 2-minute quiz — delivered to your inbox to keep your streak alive.
The table chart (There are pie charts and bar charts. There is no such thing as a table chart. ) provides a breakdown (wrong word) of the amount of natural gas consumption and production in different countries in 2001.
Overall, the USA had most
 Related Questions