
[Writing task 1] Incomes and spending on food and clothes of one avarage family in a UK city
Please review and give me feedback on my work. Thanks in advance
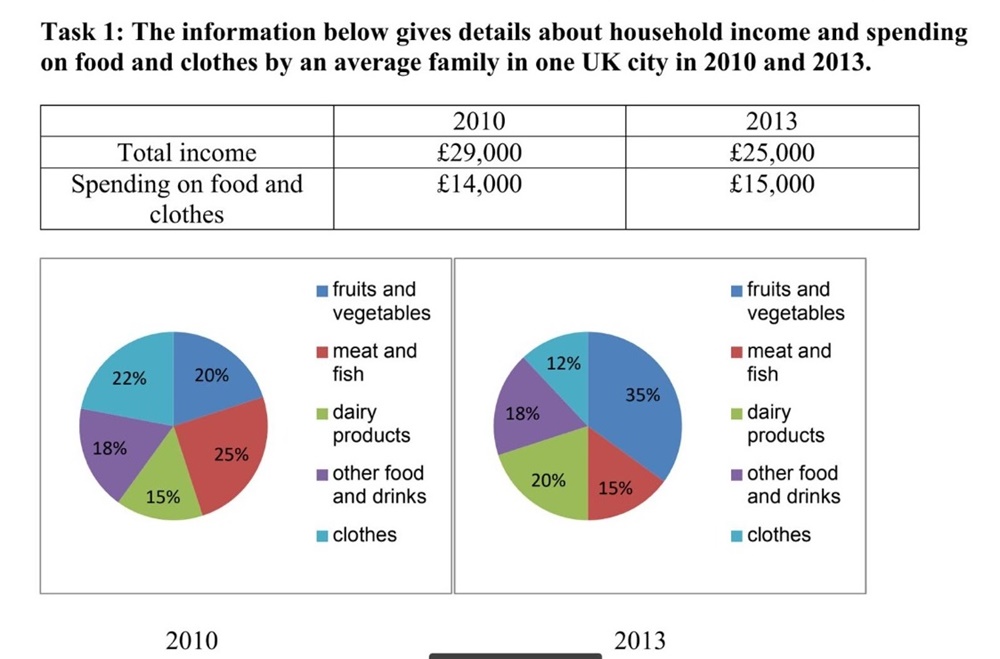
The table provides the amount one family in a city in the UK averagely earns and their specific expenditures on food and clothes in 2010 and 2013. And the pie charts give detailed comparison of spending on five main elements in the two given years.
It is easy to comprehend that although household income notably decreased by $4000, the budget allocated for eating and wearing slightly expanded. Spending on food dominantly accounted for more than three quarters in the two given years while expenditures on clothes took up a modest portion and was cut off roughly by half in 2013.
An interesting contrast can be seen in eatable products from plants and animals. Although in 2010 meat and fish cost the city’s residents most with 20% spending, the figure drastically fell by 10% and ranked last among food and beverages in 2013. While fruits and vegetables’ share rose significantly from a fifth to a third of total expense in two years and gained the dominant portion.
The rest of the expenditures on dairy products and other food and drinks did not witness considerable changes. Food from milk was consumed with 15% of spending in 2010 and rose to 10% in 2013 and other products remained unchanged with 18% over two years.
Top answer
The table provides the amount one family (incorrect - it is not the income of one single family. g. He talks quietly .
- The table provides the amount one family (incorrect - it is not the income of one single family.
- g.
- He talks quietly .
- She eats slowly .
- The sun shines brightly .
Get the Weekly English Kit 📬
New words, one handy idiom, and a 2-minute quiz — delivered to your inbox to keep your streak alive.
The table provides the amount one family (incorrect - it is not the income of one single family. It is the computation of the sum of all the family incomes divided by the number of families.) in a city in the UK averagely (wrong - Averagely cannot be used as a modifier of the verb "
 Related Questions