
Writing task 1. I'm so bad at this please help me to correct it and give me some advice to improve. Thank you very much.
The bar chart shows the number of people who visited different museums in London. Summarise the information by selecting and reporting the main features, and make comparisons where relevant
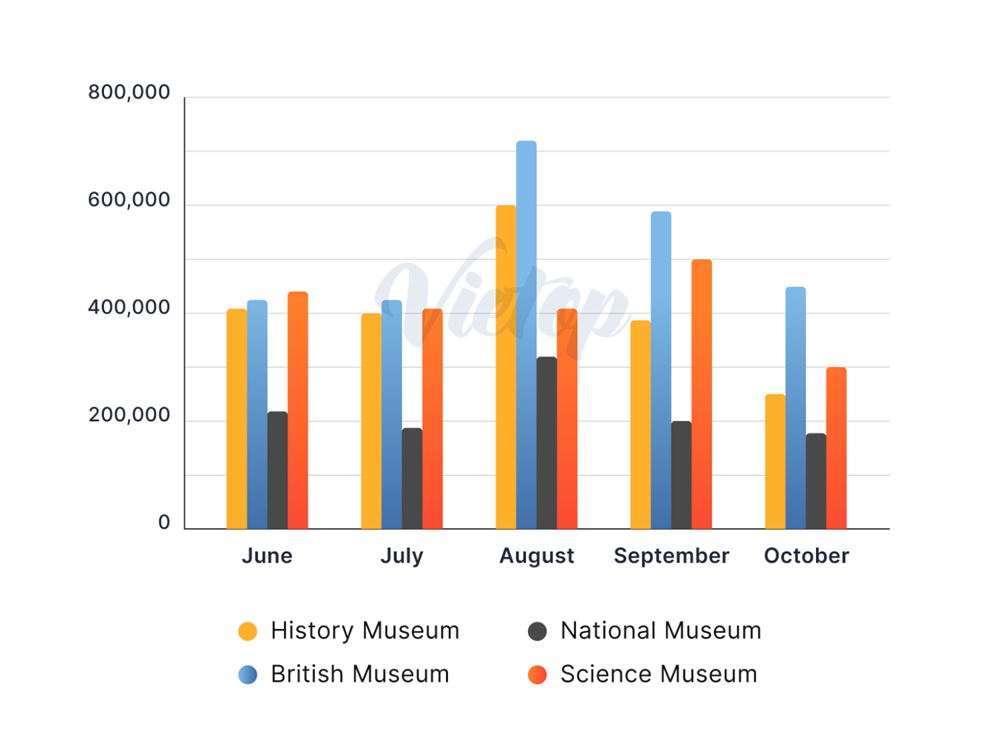
The give bar chart compares the quantity of individuals visiting four specific London museums, which is History, British, National, and Science Museums in 5 consecutive months from June to October.
Overall, over a period, British Museum gained more popularity while it was lesser favorable choice in visiting other surveyed locations.
In the first two months, there was a stablity in the number of visitors to each mentioned museums. History, British, and Science Museums was the most prevelant choice, atracting around 400.000 guests in both June and July. However, National Museum gained the smallest quantity of visiors, with merely 200.000 in two months.
Over the next three months, Science Museum had no change in August's visitor traffic, followed by a significant rise to 500.000 visitors in September and a sharp fall to about 450.000 guests in October. In contrast, the figure for other destinations witnessed a dramatic change. While the proportion of people visiting British Museum reached a peak in August, it reduced by one-third to about 450.000 in October. Following the similar fashion, after attracting more guests in August, the figure for History and National Museums slumped to approximately 250.000 and 190.000 visitors, respectively, in the following two months.
Top answer
The give (Do not use "given" "provided" "shown" or other participles. It is unnatural for native speakers and usually these words are postpositional. Instead, give words that describe the graphic.
- The give (Do not use "given" "provided" "shown" or other participles.
- It is unnatural for native speakers and usually these words are postpositional.
- Instead, give words that describe the graphic.
- If you read my advice, you will find many such words.
- ) time-series clustered bar chart compares the quantit y (We never use "quantity" for people.
Get the Weekly English Kit 📬
New words, one handy idiom, and a 2-minute quiz — delivered to your inbox to keep your streak alive.
The give (Do not use "given" "provided" "shown" or other participles. It is unnatural for native speakers and usually these words are postpositional. Instead, give words that describe the graphic. If you read my advice, you will find many such words. ) time-series clustered bar chart
 Related Questions