
WRITING TASK 1 (IELTS PRACTICE TEST PLUS 3 - TEST 1)
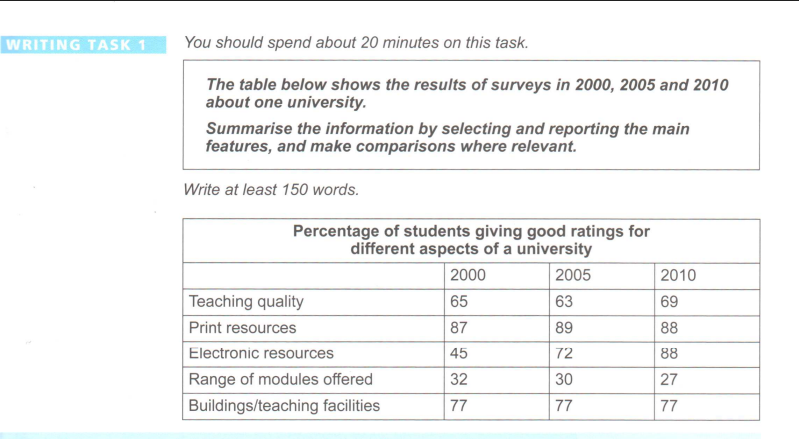
The table represents the percentage of students reviewing the quality of a university in 2000, 2005 and 2010. These surveys are based on five aspects: teaching quality, print resources, electronic resources, range of modules offered and building/teaching facilities.
Overall, the number of good ratings for the first three fields were upward while that of remaining aspects remained unchanged or even decreased though a three-year-stage.
Print resources accounted for 87% of good ratings, which was superior to 77% for facilities, 65% for teaching quality in 2000. Electronic resources and ranges of modules offered, however, were about a half and one-third of print resources respectively.
In the next five years, the quantity of votes for print resources just increased by 2%, which was roughly 10 times as low as that of electronic resources (72%). Both teaching quality and range of modules offered were given fewer good responses by 2%, compared to 65% and 32% in 2000.
In the year 2010, only the range of modules offered continued to receive fewer high ratings (27%) whereas both print resources and electronic resources met the demand of most students (88%). Additionally, an insignificant rise in good marks for teaching was shown in 69% while only facilities kept the same rate at 77% in three surveys conducted.
(212 words)
Top answer
The table represents (wrong verb) the percentage of students reviewing the quality of a university (Incorrect - is it the percentage of the entire student body who participated in the survey? ) in 2000, 2005 and 2010. ) teaching quality, print resources, electronic resources, range of modules offered and building/teaching facilities.
- The table represents (wrong verb) the percentage of students reviewing the quality of a university (Incorrect - is it the percentage of the entire student body who participated in the survey?
- ) in 2000, 2005 and 2010.
- ) teaching quality, print resources, electronic resources, range of modules offered and building/teaching facilities.
- Overall, the number percentage of good ratings for the first three questions fields were upward (wrong phrase - were higher, went up, increased, rose ) while that of the other two r emaining aspects remained unchanged or even decreased though a three-year-stage .
- (wrong phrase) Print resources accounted for 87% of good ratings , (wrong phrase.
Get the Weekly English Kit 📬
New words, one handy idiom, and a 2-minute quiz — delivered to your inbox to keep your streak alive.
The table represents (wrong verb) the percentage of students reviewing the quality of a university (Incorrect - is it the percentage of the entire student body who participated in the survey? ) in 2000, 2005 and 2010. These surveys asked about
Sample essay
A university conducted a survey in 2000, 2005 and 2010 asking about its teaching quality, print resources, electronic resources, range of modules offered, and the facilities. The table lists the percentages of "good" ratings in each category.
Overall, the majority of respondents gave good ratings, but there were some notable exceptions
 Related Questions