
Writing task 1 - help me please thank you
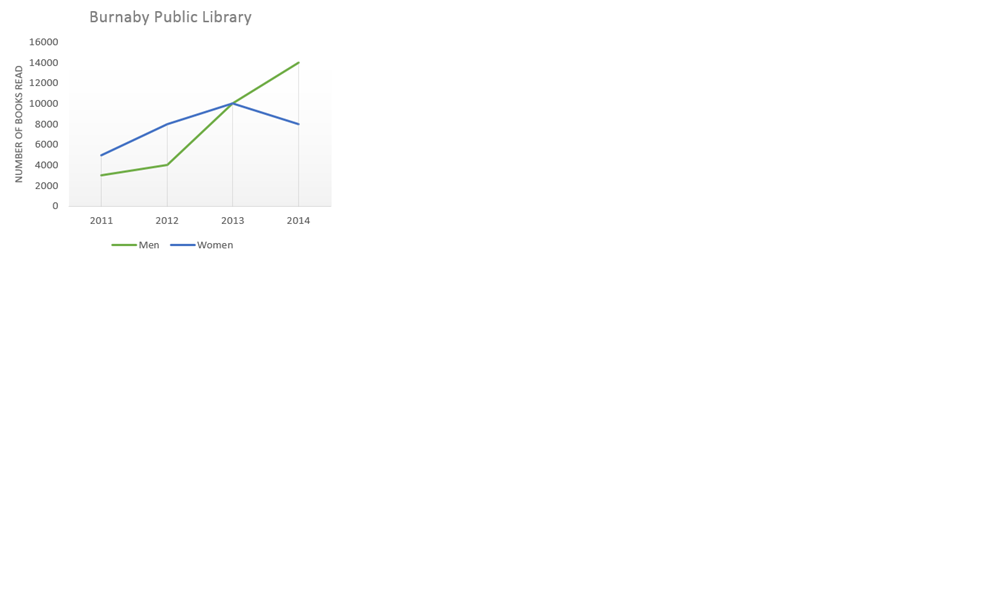
The line graph illustrates the amount of books read by man and woman in Burnaby public library between 2011 and 2014.
A glance at the line graph, it is clear that the number of man were interested in the book escalated significantly into the period. By contrast, there was a decline in number of books read by woman.
At the beginning, in 2011, the amount of books read by man was about 3000 which was 2000 fewer than number of books read by female readers. Since then, there was a considerable growth of quantity of books read by male readers from 2012 and peaked the highest point at 14000 in 2014.
On the other hand, since 2011, the amount of books read by woman developed dramatically and hit the peak at 10000 in 2013. However, there was a downward trend in the number of books read by woman in the next year, which dropped to 8000 in 2014.
Top answer
The line graph illustrates the amount of books read by man (Which man? ) and woman in Burnaby public library between 2011 and 2014. A glance at the line graph , it is clear that the number of man (missing word) were interested in the book escalated significantly into the period.
- The line graph illustrates the amount of books read by man (Which man?
- ) and woman in Burnaby public library between 2011 and 2014.
- A glance at the line graph , it is clear that the number of man (missing word) were interested in the book escalated significantly into the period.
- By contrast, there was a decline in (missing word) number of books read by woman .
- At the beginning, i I n 2011, the amount of books read by man was about 3000 which was 2000 fewer than (missing word) number of books read by female readers.
Get the Weekly English Kit 📬
New words, one handy idiom, and a 2-minute quiz — delivered to your inbox to keep your streak alive.
The line graph illustrates the amount of books read by man (Which man? Mr Smith or Mr Jones?) and woman in Burnaby public library between 2011 and 2014.
A glance at the line graph, it is clear that the number of
 Related Questions