
Writing Task 1: energy is used in an average Australia household
Please could you review my writing? Thank you so much!
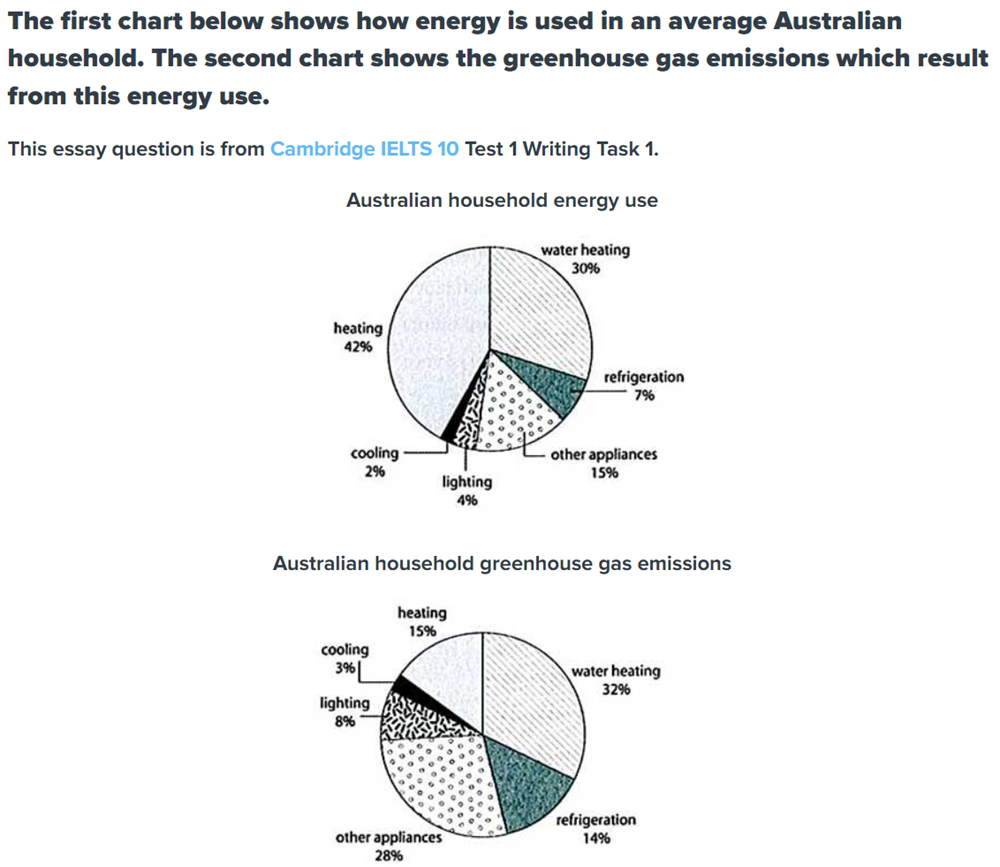
The pie charts illustrate the proportion of five different patterns of using energy and its greenhouse gas emissions in an average household in Australia.
It is clear from the charts that the amount of carbon dioxide emissions from most of the methods are significantly more than the energy they use, except for heating in an average household. Also, Heating is by far the most important means of using energy.
Heating accounts for the largest proportion of energy used in an average household at 42%, but contribute just 15% to total greenhouse emission. By contrast, while Australians consume only 4% of energy for lights, 7% for refrigeration and 15% for other appliances, proportions gas emissions released by these patterns are twice the percentages of energy used, at 8%, 14% and 28% respectively.
On the other hand, cooling is the method that uses the least amount of energy, only 2% of energy is used, and its gas emission constitutes only 3% in total. Besides, over a quarter of energy is used for heating water in an average home, there is only a small increase in the proportion of greenhouse gas emissions by 2% compared to the proportion of energy used.
Top answer
Please read my advice for Task 1 essays: IELTS TASK 1: Hints, Tips And Advice Vocabulary Words For Task 1: Reference Post
- Please read my advice for Task 1 essays: IELTS TASK 1: Hints, Tips And Advice Vocabulary Words For Task 1: Reference Post
Get the Weekly English Kit 📬
New words, one handy idiom, and a 2-minute quiz — delivered to your inbox to keep your streak alive.
Please read my advice for Task 1 essays:
The (How many? Read my advice.) pie charts illustrate (poor word choice. Read my advice.) the proportion of five different patterns (Incorrect word - these are not "patterns". What are they? Name them. Read my advice. ) of using energy and its greenhouse gas emissions in an avera
Sample essay:
The two pie charts compare first, the energy consumption and second, greenhouse gas emissions of six different types of appliances in a typical Australian household. These are heating, water heating, cooling, lighting, refrigeration and “other appliances”.
Overall, two types, heating and water heating, consume nearly three-quarters of the total energy
 Related Questions