
WRITING TASK 1 (CAM 11- TEST 1): PIE CHARTS
WRITING TASK 1:
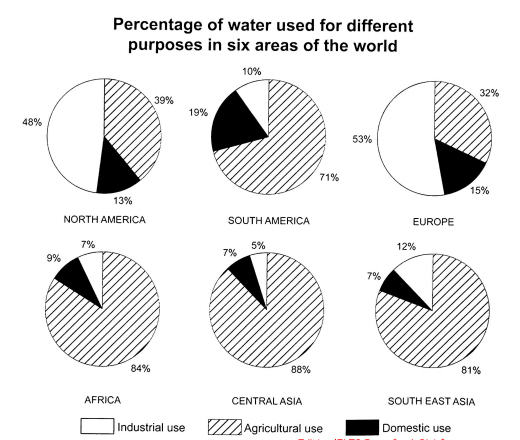
The charts below show the percentage of water used for different purposes in six areas of the world. Summarise the information by selecting and reporting the main features, and make comparisons where relevant.
MY WRITING:
The six pie charts show the amount of water used for industrial purpose, agricultural purpose and domestic purpose in six regions. These regions are North America, South America, Europe, Central Asia and South East Asia.
Overall, over two-third of the total amount of water in each area is supplied for agricultural use, except for two cases of North America and Europe.
A deep analysis reveals that water supplies for agriculture in Central Asia are most enormous with 88%, which is followed by 84% in Africa, 81% in South East Asia and 71% in South America. The consumption of water in North America and Europe, in contrast, is mostly diverted to industrial use with 48% and 53% respectively whereas that of four remaining regions accounts for 8.5% on average. The percentage of water used for domestic purpose in South America is dominant with 19%, compared to 15% in Europe, 13% in North America and only 9% in Africa. In addition, both Central Asia and South East Asia recorded the same amount of water used for domestic aim (7%), which is about three times as low as that in South America.
(189 words)
Top answer
Please post essays, paragraphs, dialogues and other writing in the essay forum so a moderator does not have to move your post. htm
- Please post essays, paragraphs, dialogues and other writing in the essay forum so a moderator does not have to move your post.
- htm
Get the Weekly English Kit 📬
New words, one handy idiom, and a 2-minute quiz — delivered to your inbox to keep your streak alive.
Please post essays, paragraphs, dialogues and other writing in the essay forum so a moderator does not have to move your post.
https://www.englishforums.com/English/EssayReportCompositionWriting/Forum9.htm
The six pie charts show break down the amounts of water used for three purposes - industry, agriculture and residential - industrial purpose, agricultural purpose and domestic purpose in six regions. These regions are North America, South Americ
This essay is too long, but is useful to study how to write essays on pie charts.
Paragraph #1: Describe the figure but not the information content:
The pie charts compare the relative amounts of water used in three different economic sectors (Industry, Agriculture and Domestic use) among six regions of the world, four continents (Europe, Africa, North and South America) and two
The pie charts demonstrates the use of water in three different criterion by various areas of the world. It calabrated in percentage.Overall, agriculture purpose have gained most ratio of water used compare to other areas. Moreover, two in six places used water for industrial is major. Certainly, the ratio of usage water for
 Related Questions