
Writing Task 1 Bar Chart
Please review it. Thanks.
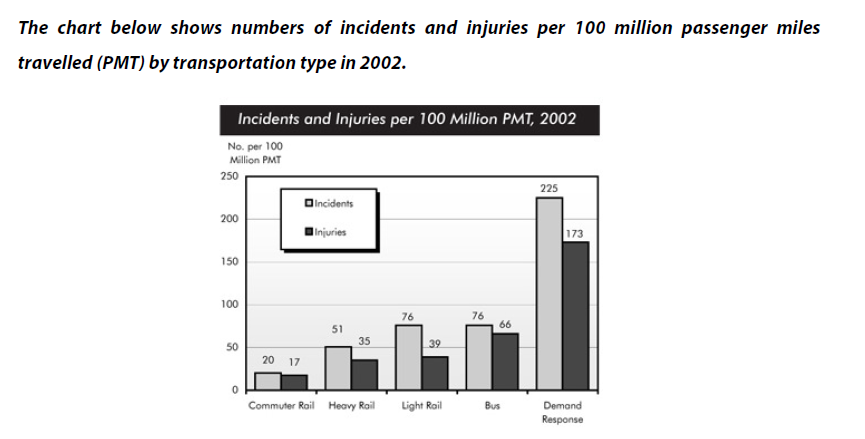
The bar chart gives information about the number of incidents and injuries every 100 million passenger miles travelled (PMT) on 5 types of transportation in 2002.
Overall, the number of incidents and injuries occurred the most on demand response. In contrast, commuter rail is the transportation type that occurred the least.
In 2002, demand response was the most dangerous mode of transport with 225 incidents PMT and 173 injuries PMT. On the other hand, the number of incidents and injuries by commuter rail was the lowest, only 20 and 17, respectively.
It can be seen from the provided information that light rail and bus have the same number of incidents, at 76, but while the number of injuries by light rail was only 39, the figure for bus was up to 66. The quantity of incidents and injuries by the remaining traffic, heavy rail, which was lower than the two transportation types above, was 35 and 26 respectively.
Top answer
The bar chart gives information about the number of incidents and injuries for every 100 million passenger miles travelled (PMT) on 5 types based on five categories of transportation in 2002. Overall, the number of incidents and injuries occurred the most on in the deman d-r esponse category . In contrast, commuter rail is was the safest because it was transportation type that occurred experienced the least number of injuries and incidents .
- The bar chart gives information about the number of incidents and injuries for every 100 million passenger miles travelled (PMT) on 5 types based on five categories of transportation in 2002.
- Overall, the number of incidents and injuries occurred the most on in the deman d-r esponse category .
- In contrast, commuter rail is was the safest because it was transportation type that occurred experienced the least number of injuries and incidents .
- In 2002, demand response was the most dangerous mode of transport with 225 incidents PMT and 173 injuries PMT.
- On the other hand, the number of incidents and injuries by commuter rail was the lowest, only 20 and 17, respectively.
Get the Weekly English Kit 📬
New words, one handy idiom, and a 2-minute quiz — delivered to your inbox to keep your streak alive.
The bar chart gives information about the number of incidents and injuries for every 100 million passenger miles travelled (PMT) on 5 types based on five categories of transportation in 2002.
Overall, the number of incidents and injuries occurred the most on
 Related Questions