
Writing task 1 - bar chart
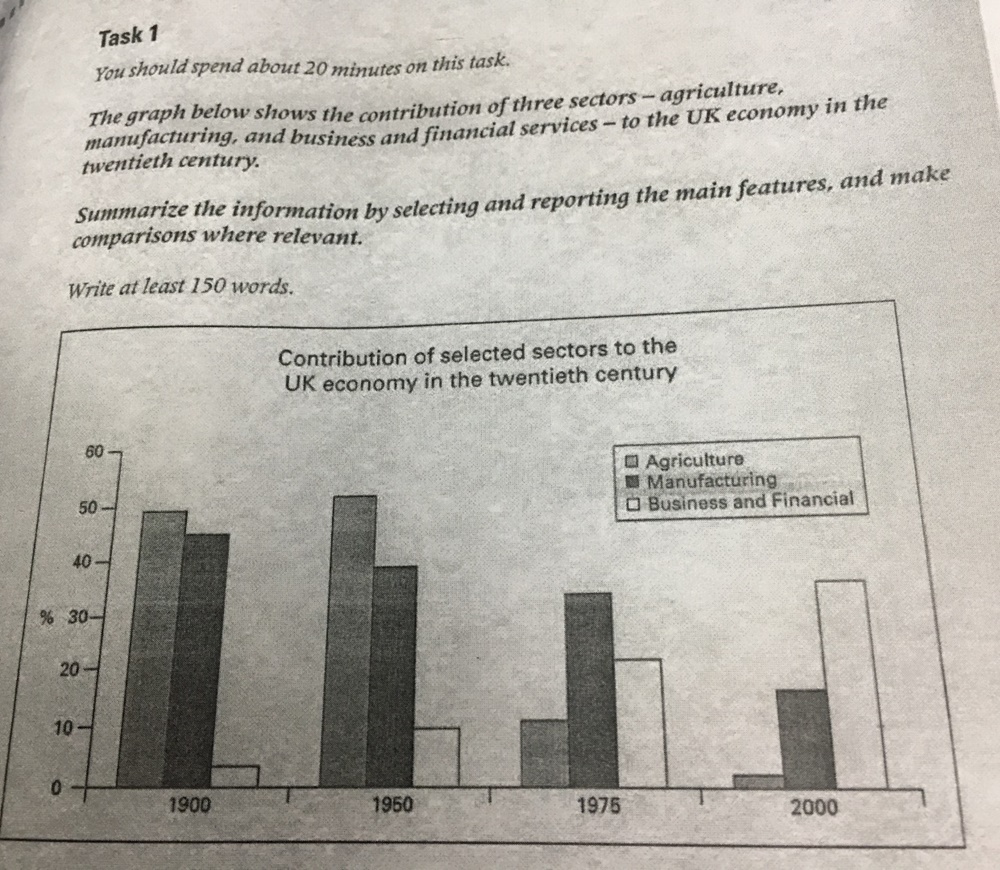
The bar chart indicates the proportion of three chosen sectors including agriculture, manufacturing and business and financial sectors contributing to the economy of the United States in a period of 100 years from 1900 to 2000
As can be seen from the chart, much more agriculture and Manufacturing than Business and Finance services contributed to the economy of UK. Agriculture sector accounted for 50% of total contribution, following by manufacturing field with appropriately 45%, whereas Business and Financial services was about 3% at the beginning.
It is can be seen that the trend of agriculture sector between 1900 and 2000 was downward. The highest percentage of agriculture’s contribution stands at above 50% in 1950, then, decreased rapidly to 10% in 1975 and reached the lowest proportion of 2% in 2000. Manufacturing field has the similar pattern with a lower level of decreasing. It reduced gradually to under 40% in 1950, to about 35% in 1975, and then under 20% in 2000. For Business and Financial service, on the other hand, shows an upward trend. It started from 2% in 1900, and ended up to 35% at the end of the period, also the highest percentage of contribution to the UK economy among selected sectors.
WRITE DESCRIPTION HERE
Get the Weekly English Kit 📬
New words, one handy idiom, and a 2-minute quiz — delivered to your inbox to keep your streak alive.
 Related Questions