
Writing task 1-bar chart
the bar chart below shows the percentage of unemployed graduates, aged 20-24, in one European country over a two-year period.
Summarise the information by selecting and reporting the main features, and making comparisons where relevant.
Write at least 150 words.
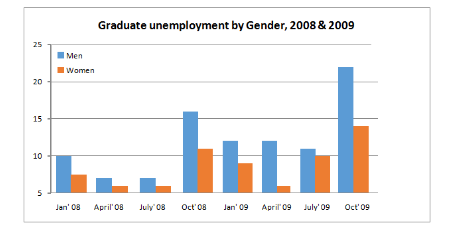
The bar graph illustrates data about unemployment rate of 20-24-year-old graduates for both sexes in a certain European country in two consecutive years,2008 and 2009
Overall, more males than females faced to the unemployment situation over the examined period and more strikingly, there was a rapid upward trend in the percentages of both unemployed male and female school-leavers.
In January 2008, 10% of male graduates were out of work which was 4% higher than that of female counterparts. These figures for both genders decreased and then remain unchanged 7 following months at 6% for men and well under 1% for women. The unemployment percentages of both males and females saw a significant increase to over 15% and 10 %, respectively in October that year.
In the next year, there are greater variations in the rate of unemployed men than that of women. It can be seen that the proportion of men who had no job dropped substantially to around 12% in January, followed by a stable level in 4 following months and then decreased slightly to around 11% in July. By contrast, the figure for women went in a different pattern. After a dramatic fall to approximately 2 % in April, it then raised significantly to 10%. At the end of the period, the percentage of male unemployees reached a peak at 22%, making it far much higher than that of female ones.
Top answer
The bar graph illustrates data about (missing words) unemployment rate of 20-24-year-old graduates for both sexes in a certain European country in two consecutive year s,2 008 and 2009 (missing punctuation) Overall, more males than females faced to the unemployment situation (awkward, unnatural) over the examined period and more strikingly, there was a rapid upward trend in the percentages of both unemployed males and females school-leavers . ) In January 2008, 10% of (missing word) male graduates were out of work which was 4% higher than that of their female counterparts. These figures for both genders decreased and then remain unchanged (missing words) 7 following months at 6% for men and well under 1% for women.
- The bar graph illustrates data about (missing words) unemployment rate of 20-24-year-old graduates for both sexes in a certain European country in two consecutive year s,2 008 and 2009 (missing punctuation) Overall, more males than females faced to the unemployment situation (awkward, unnatural) over the examined period and more strikingly, there was a rapid upward trend in the percentages of both unemployed males and females school-leavers .
- ) In January 2008, 10% of (missing word) male graduates were out of work which was 4% higher than that of their female counterparts.
- These figures for both genders decreased and then remain unchanged (missing words) 7 following months at 6% for men and well under 1% for women.
- The unemployment percentages of both males and females saw a significant increase to over 15% and 1 0 % , respectively in October that year.
- In the next year, there were are greater variations in the rate of unemploy ment for men than that of women.
Get the Weekly English Kit 📬
New words, one handy idiom, and a 2-minute quiz — delivered to your inbox to keep your streak alive.
The bar graph illustrates data about (missing words) unemployment rate of 20-24-year-old graduates for both sexes in a certain European country in two consecutive years,2008 and 2009 (missing punctuation)
Overall, more males than females faced to the unemployment situation (awkw
 Related Questions