
Writing Task 1: A Chart
The chart below shows the percentage of households in owned and rented accommodation in England and Wales between 1918 and 2011.
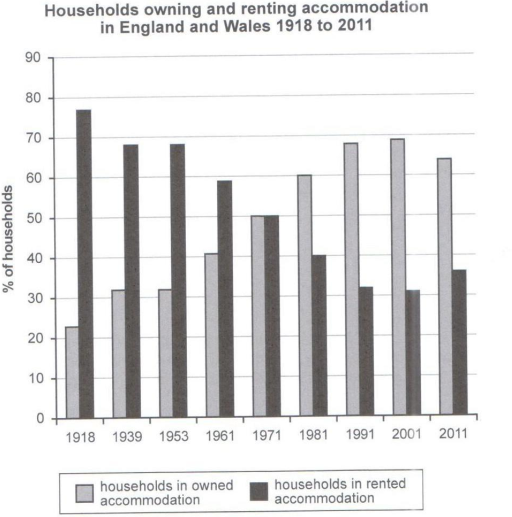
The bar chart illustrates the changes in the rate of families having and renting accommodation in the UK and Wales from 1981 to 2011.Overall, England and Wales families were likely to living in rented accommodation from 1918 to 1961, whereas the majority of families in these areas preferred to live in owned accommodation from 1981 to 2011.
In 1918, the percentage of families living in rented accommodation was the highest with over 75%, compared to about 25% of households buying their own houses being the lowest. Twenty years later, while the percentage of lodgers in England and Wales showed a significant drop from over 75% to under 70%, but the rate of home buyers witnessed a moderate rise from over 20% to over 30%. Then the proportion of tenants and home buyers remained relatively stable at under 70% and over 30% respectively from 1939 to 1953.
From 1953 to 1991, there was a significant drop in the proportion of tenants from over 65% to approximately 30%, while the rate of families owning their houses grew moderately from over 30% to over 65%. Particularly, in 1971, both the former and the later have the same percentage with 50%. In the next twenty years, the former declined slightly, and then went up substantially by about 5% while there was a marginal increase in the former, followed by a moderate fall from approximately 70% to under 65%.
Top answer
The descriptions "over X" and "under X" are not good. For example, if I say "The number of people watching the football game is over 25," there could be 123,784 or 26. The upper bound is unlimited.
- The descriptions "over X" and "under X" are not good.
- For example, if I say "The number of people watching the football game is over 25," there could be 123,784 or 26.
- The upper bound is unlimited.
- If I say "The number of people watching the football game is under ten thousand," there could be 1 person or 9,999 people.
- What would a university professor think about that?
Get the Weekly English Kit 📬
New words, one handy idiom, and a 2-minute quiz — delivered to your inbox to keep your streak alive.
The descriptions "over X" and "under X" are not good. For example, if I say "The number of people watching the football game is over 25," there could be 123,784 or 26. The upper bound is unlimited. If I say "The number of people watching the football game is under ten thousand," there could be 1 person or 9,999 people. What would a university professor think about that?
The bar ch
The bar chart provides information about the percentage of families who own an accommodation and who rent it in England and Wales over a 93 year period from 1918 to 2011.
The bar chart provides information about the percentage of families who own an accommodation and who rent it in England and Wales over a 93 year period from 1918 to 2011.
Overall, the percentage of households in owned accommodation was less than rented ones for the first 43 years, while it rose up steadily from 1971 till 2001 and reached its peak in 2001, then a slight decrease occured b
 Related Questions