
Writing Task 1 (a bar chart and a line graph)
You should spend about 20 minutes on this task.
The chart and graph below give information about participants who have entered the Olympics since it began.
Summarise the information by selecting and reporting the main features, and make comparisons where relevant.
Write at least 150 words.
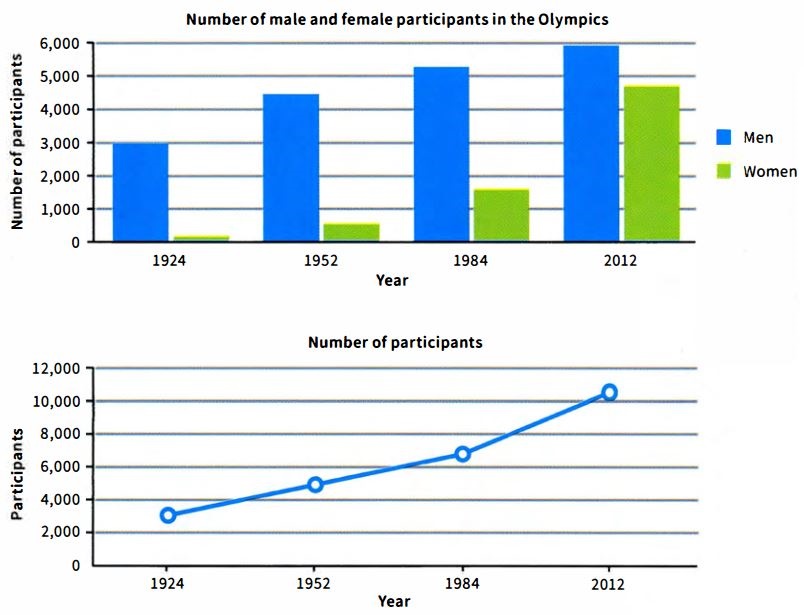
The bar chart shows the number of men and women participated in the Olympic games while the line graph gives the number of all participants in the Olympics. The data is given for four years which are 1924, 1952, 1984 and 2012.
Overall, The number of all participants grew steadily through these years and the proportion of women who compete in the Olympic games increased among these 88 years.
The number of men participated in the Olympic games rose gradually and almost doubled from 3000 in 1924 to about 6000 in 2012. Although the number of women who were present in the Olympics was lower than men in all four years, females’ contribution to the games had a dramatic change. Just approximately 100 participants from about 3100 participants in the Olympic games 1924 were women, while in 2012 there were more than 4500 women between a few more than 10000 players in the Olympic games (about 40% of whole participants).
Top answer
] who participated in the Olympic G ames while the line graph gives the number of all participants in the Olympics from 1924-2012 . The data in the bar chart is given for four year s, which are 1924, 1952, 1984 and 2012. The underlined part was not true of the line graph!
- ] who participated in the Olympic G ames while the line graph gives the number of all participants in the Olympics from 1924-2012 .
- The data in the bar chart is given for four year s, which are 1924, 1952, 1984 and 2012.
- The underlined part was not true of the line graph!
- Overall, t he number of all participants grew steadily through these years [and the proportion of women who compete d in the Olympic G ames increased among over these 88 years].
- 1) In the "overall" paragraph you missed a very important observation: in the first half of the period female participation was minimal.
Get the Weekly English Kit 📬
New words, one handy idiom, and a 2-minute quiz — delivered to your inbox to keep your streak alive.
The bar chart shows the number of men and women [participate is intransitive.] who participated in the Olympic Games while the line graph gives the number of all participants in the Olympics from 1924-2012. The data
The bar graph provides information about the number of male and female participants in the olympics since it began. However the line graph below depicts the overall number of people participated in the olympics from 1924 to 2012.
Overall , there were significant rises in the number of participants in the olympics , and it was clear that despite the surge of men participants in the oly
 Related Questions